lect_22_Global change
advertisement
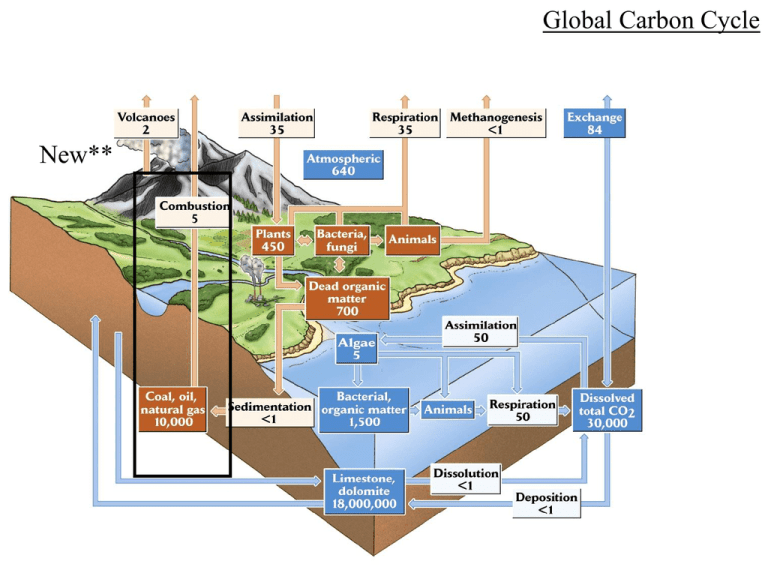
Global Carbon Cycle New** http://temagami.tosm.ttu.edu/khayhoe/climate_slides/index.htm Charles Keeling C02 is not the only greenhouse gas – Water vapor is the most potent but also the most enigmatic since clouds can both reflect and trap heat Methane (60x; ~15%), Nitrous Oxide (270x),…30 others Sources of anthropogenic C02: Coal: 41% Oil: 39% Natural gas: 27% 56% of all C02 humans have ever liberated is still aloft – - contributes to 80% of Global warming According to NOAA and NASA data, the Earth's average surface temperature has increased by about 1.2 to 1.4ºF since 1900. Keep in mind that these are global averages – some parts of the world may actually get colder Closer to the poles the increase is more extreme – Alice Springs, Australia has increased 5ºF over the 20th century The tropical Pacific ocean commonly dipped below 66.5ºF between 1945-1955; since 1976 it has rarely dropped below 77ºF Think Global Change… For every 18ºF the amount of water vapor the air holds 2x as much water vapor For every 18ºF the amount of water vapor the air holds 2x as much water vapor – “Hurricane Fuel” One gram of water evaporating from your skin transfers 580 calories of heat Extrapolate this transfer of energy from one gram of water on your body to an entire ocean and imagine the energy created Its complicated: aerosols – tiny particles suspended in air – and global dimming. 100 ppm increase in CO2 can increase surface temps by 9ºF. Why haven’t they (1.13ºF vs 9ºF)? Aerosols Global cooling in the 1940-70s due to high sulphur dioxide emissions Scrubbers installed to combat acid rain turned this around Airplane contrails create persistent cloud cover – the grounding of US flights post 9/11 resulted in an unprecedented increases in daytime (relative to nighttime) temps. 1991 eruption of Mt Pinatubo (Philippines) ejected 20 million tons of sulphur dioxide – NASA predicted a 0.5ºF global cooling – exactly as predicted Predictions ~10 different global circulation models – the best appears to be the Hadley Model They all predict around a 2-5ºC increase in mean global surface temps How will the Biological World respond? (1) Extinction (e.g., loss of habitat)/Opportunity (gain of habitat) (2) Range shifts – if possible (3) changes in phenology/timing Major disruption as new communities are assembled Global climate change and mammalian species diversity in U.S. national Parks. PNAS 100:11474-11477 125-145 spp before the Polynesians arrived 71 native landbirds at the arrival of Captain Cook Currently 23 are extinct and most remaining threatened (10 spp haven’t been seen in 10+ years) ~ 1830, the first mosquito species, Culex quinquefaciatus, arrives 1939 Avian malaria noted ~ 1905 avian malaria parasite, Plasmodium relictum, arrives with introduced birds Plasmodium parasites cannot develop < 13º C Peak prevalence occurs at 17º C. native birds abundance vector malaria 500 1000 1500 Elevation (m) 2000 Present day and prediction of land area (km2) on three Hawaiian Islands under a 2º C increase <17º C (today): 1900 < 17º C (2º C): 1171 (-38%) 12349 15236 7799 (-37%) 2299 (-85%) Marmots come out of hibernation based on temperature (too early), since snowpack has not changed. The absence of food/hi metabolic puts stress on marmot populations In contrast, ground squirrels & chipmunks hibernate 2-4 weeks longer whereas American robins migrate to the CO Rockies ~2 weeks earlier Climate claims the golden toad? discovered/named in 1966 – gone ~1987. - Pacific ocean warming - elevated dew point - Rising cloud line shade, cool weather, and rainfall patterns had not varied but since 1976 the number of mistless days increased per year coalescing into long enough runs for desiccation to cause extinction
