Slide 1 - AACC – Houston
advertisement
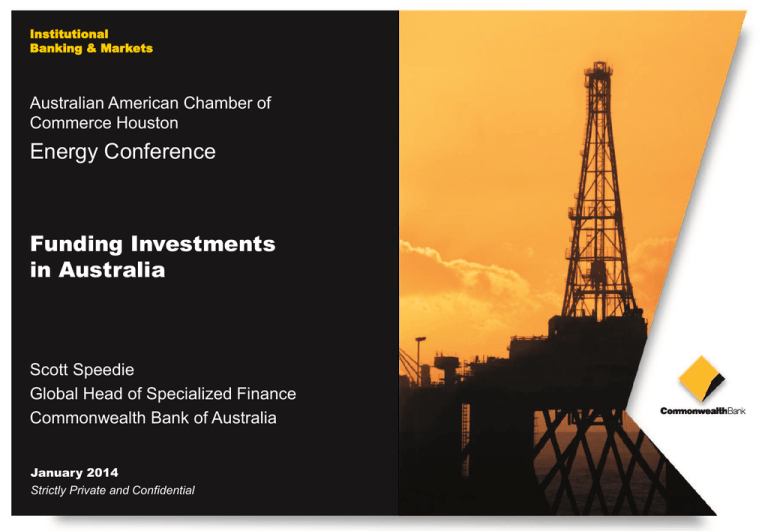
Institutional Banking & Markets Australian American Chamber of Commerce Houston Energy Conference Funding Investments in Australia Scott Speedie Global Head of Specialized Finance Commonwealth Bank of Australia January 2014 Strictly Private and Confidential The Commonwealth Bank of Australia Australia’s largest bank by market capitalisation KEY FINANCIALS Statutory NPAT Cash NPAT Return on equity Total assets 14.6m 3,000 Customers Institutional Clients Industry specialisation and understanding make the Bank an ideal partner providing balance sheet strength and broad product capability Cash earnings per share Dividend per share Basel III CET1 (International) LIQUIDITY (AUD) Oil & Gas industry teams placed in key commercial and financing hubs. CBA is a Bank that actively deploys balance sheet into our client’s businesses Broad range of debt products spanning project, corporate and acquisition finance Strong global financial markets capabilities across commodities, foreign currency and interest rates The only domestic Australian bank with a full in-house equity business, focused on retail and institutional clients $101b June 2011 $135b June 2012 $137b June 2013 CREDIT RATING A$7,677m A$7,819m 18.4% A$754b A$4.86 A$3.64 Moody’s Fitch Market Capitalisation (US$bn) Global Market Capitalisation Ranking Senior Debt Rating Moody’s S&P 268.02 1 A2 A+ 243.52 2 A3 A 232.44 4 Aa3 A+ 198.11 6 Baa2 A- 183.81 7 Baa2 A- 124.01 10 Aa2 AA- 104.29 15 Aa3 AA- 92.91 18 Baa1 A- S&P 11.0% GLOBAL COMPARISON Source: Bloomberg. As at 13 January 2014. Credit rating: S&P 2 Funding Options for Upstream Companies Equity Project Finance Reserve-Based Lending Development Finance Small Borrowing Base refinance Exploration Single Field Development Start-Up Few Producing Fields Balance Sheet Lending Large Borrowing Base refinance Several Producing Fields plus Permitted Development Assets Development of an E&P Company Corporate Credit Facility refinance Large Portfolio of Producing Fields Development Assets plus Exploration Acreage Mature E&P Funding Investments In Australia 3 Australian Equity Market Where does Australia stand? Market Capitalisation of Global E&P Stocks $80 13% $70 5% US Canada 49% 18% Australian Secondary Issuances (A$bn) E&P Other $60 Asia Pac (ex Aus) $50 Australia $40 Other $30 $20 15% $10 $0 2006 2007 2008 2009 2010 2011 2012 2013 Source: CBA and Bloomberg Funding Investments In Australia 4 Australian Loan Markets Australian Loan Market Volumes (A$bn) 140 13.658 Energy and Resources Other 120 9.934 3.75 100 13.078 80 60 4.41 116.042 95.066 40 53.29 103.25 66.122 20 0 2009 2010 2011 2012 2013 5 LNG – Advent of Major Australian Energy Projects 7 LNG projects in Australia currently under construction – A$194bn total capex value Australia benefits from geographic proximity to Asia Ichthys LNG Project (A$42bn): – Largest project finance globally – Quality sponsors – Inpex (Japan) and Total (France) – A$20bn of debt – funded by export credit agencies and commercial banks – Forecast A$3.5bn p.a. contribution to GDP – Supported by long term take or pay LNG sales contracts into Asia – LNG prices are oil-linked Funding Investments In Australia 6 Project Finance/Development Finance Project finance Lending to complete a specific project Repayment of debt from project cash flow Security over borrower and assets Lenders’ recourse is often limited to the project itself Australia – 2nd largest market for project finance (after the United States) with 10% global share of project finance in 2013 Development project finance is common and characterised by Extensive technical due diligence P90 production profile Guarantee from the sponsor No dividends or asset sales Restrictions on exploration expenditure Funding Investments In Australia 7 Reserve Based Lending The structure of choice of the independent sector – flexible, revolving credit facility Reserves based lending for multiple fields – Requires diversification – no single asset must dominate portfolio – P50 reserves can be used for producing assets – Aggregate cash flows considered – Covenants and pricing are lower than for single-asset financing $ Facility size, with amortisation to zero Addition of new assets allows full utilisation of facility Extension of availability Declining value of Asset 1 time Funding Investments In Australia 8 Balance Sheet Lending Debt capacity linked to past performance Debt covenants linked to balance sheet/ P&L rather than cash flow Suited to larger independents – Fewer restrictions – Lower maintenance – Increased flexibility – Cheapest source of debt finance for the independent Company Corporate Debt (A$’bn) Total Assets (A$’bn) Market Cap (A$’bn) 4.3 24.8 31.4 3.7 17.0 13.8 2.9* 7.1 11.0 Source: Bloomberg, company annual reports * Wholly comprised of Oil Search’s guarantee of its portion of debt associated with PNG LNG project; guarantee falls away on completion. 9 Australian Bond Markets Significance of the A$ MTN market in a global context has grown since 2007 A$ MTN Monthly Issuance Volumes Monthly Bond Redemptions The A$ MTN market witnessed strong issuance activity in 2013, with total volume reaching A$97.2bn (2012: A$99.9bn). While SSAs and FIs have dominated issuance, consistent flows of corporate supply has been positively supported by investors. The A$99bn of maturities over FY14 (FY13 A$72bn) is expected to drive continued support for primary issuance $16 $10 Redemptions (A$bn) $14 A$ billion $8 $6 $4 $2 $12 $10 $8 $6 $4 $2 $0 $0 Jul-12 Sep-12 Nov-12 Bank Jan-13 Mar-13 May-13 Non-Bank Financial Jul-13 Sep-13 Nov-13 Jun Jul Aug Sept Oct Nov Dec Jan Feb Mar Apr May Jun Corporate A$ MTN Issuance by Industry A$ MTN Issuance by Sector Mining & Mining Services issuers raised A$2.3bn in the A$MTN market in 2013, accounting for 24% of total issuance (2012: 15%) Corporate issuance remains under-represented in the A$ MTN market in 2013. The overall contribution to total market supplies has improved in recent years to 10.2% (2012: 9.6% and 2011: 5.6%) as issuers have taken advantage of the very favourable demand conditions 14 deals $3.6bn A$ billion $4.0 30.0% $3.5 25.0% $3.0 $2.5 $2.0 6 deals $2.0bn 7 deals $2.3bn 14 deals $1.7bn 20.0% 15.0% $1.5 10.0% $1.0 5.0% $0.5 $0.0 0.0% Property Infrastructure & Utilities Energy & Resources Other Domestic Banks Semi SSA Foreign Bank / Branches Corporate Non-Bank Financial Source: CBA and Bloomberg as at 21 January 2014 10 Highlight Transactions 11 Specialized Finance Scott Speedie Managing Director P: +61 (0)2 9118 4333 E: scott.speedie@cba.com.au 201 Sussex Street Sydney 2000 Client Coverage Group Project Finance Grant Willis Michael Thorpe Managing Director Natural Resources Managing Director P: +44 20 77106990 E: grant.willis@cba.com.au 85 Queen Victoria St, London EC4V4HA P: +61 (0)2 9118 4337 E: thorpemi@cba.com.au 201 Sussex Street Sydney 2000 Andrew Loadsman Jon Verlander Executive Director Natural Resources Executive Director P: +61 (0)2 9118 4330 E: andrew.loadsman@cba.com.au 201 Sussex Street Sydney 2000 P: +1 713 3419751 E: jonathan.verlander@cba.com.au 811 Main Street, Suite 4675, Houston, TX, USA Jeff Heazlewood Charles Davis Director Natural Resources Executive Director P: +61 (0)2 9118 4339 E: jeff.heazlewood@cba.com.au 201 Sussex Street Sydney 2000 P: +61 (0)2 9118 4304 E: charles.davis@cba.com.au 201 Sussex Street Sydney 2000 12 This presentation does not constitute an offer to provide finance on any terms. The provision of any such offer is subject to formal review and credit approval, satisfactory due diligence, sign off by legal, tax, accounting and other professional advisers and execution of satisfactory documentation. The Commonwealth Bank shall not be bound unless and until final terms are agreed and formal documentation is signed. That final documentation may not necessarily mirror the contents of this presentation and any actions you may choose to take should not be taken in reliance on this presentation. The information contained herein is confidential and is the proprietary structure of the Commonwealth Bank. It is provided on the basis that you will not disclose its contents to any persons other than directors, employees and advisors without the written consent of the Commonwealth Bank. It is not to be discussed either directly or indirectly with any other financier. This obligation will not apply if the information is available to the public generally (except as a result of a previous breach of this confidentiality obligation) or you are required to disclose it by law. © Copyright Commonwealth Bank Australia 13


