State of the University - Faculty & Researchers : Rice University
advertisement
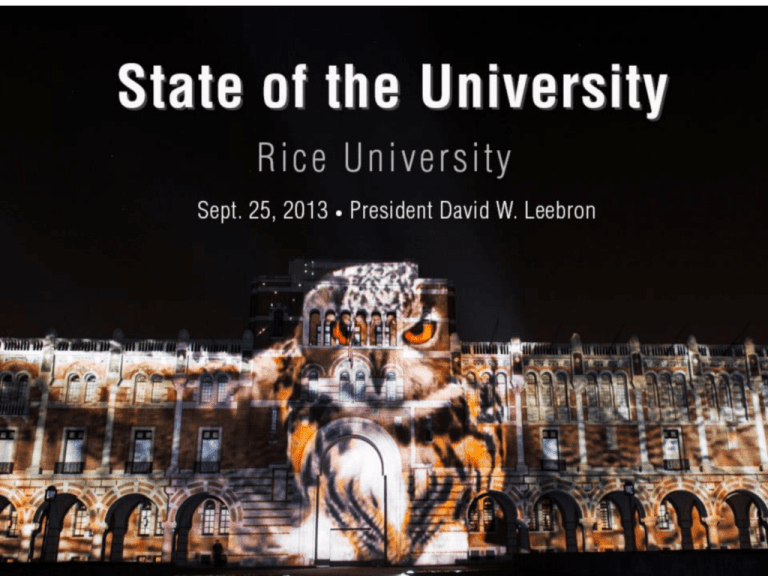
State of the University September 25, 2013 1 Our mission As a leading research university with a distinctive commitment to undergraduate education, Rice University aspires to pathbreaking research, unsurpassed teaching and contributions to the betterment of our world. It seeks to fulfill this mission by cultivating a diverse community of learning and discovery that produces leaders across the spectrum of human endeavor. 2 The State of the University Higher education landscape University updates •Student body •Research •Campus: construction and planning •Finances Looking ahead •Our aspirations for the first decade of the second century 3 Forces reshaping higher education 4 Unique higher ed environment • Extremely competitive • Dynamic • Slow and resistant to change • Highly visible and scrutinized • Extensively regulated • Widespread sense of “crisis” and “disruption” 5 2013 undergraduate entering class 6 As of Sep 2013 Source: Office of Registrar Freshmen enrollment 7 Date Created: 09/19/2013 Data Source: Office of Registrar Applications, admits and deposits 8 Date Created: 09/23/2013 Data Source: Office of Enrollment Majors awarded 9 Date Created: 09/19/2013 Data Source: Office of Registrar Graduate student enrollment 3,000 2,638 128 2,500 +42% 2,000 621 Terminal Master's in Arch, Teaching, & Music Master of Liberal Studies 140 46 Professional Master's in Engineering 517 Professional Science Master's MBA 1,000 1,426 500 Thesis Master's 1,862 142 1,500 157 70 165 71 Doctoral 1,017 Fall 2013 data is preliminary 10 Fall 2002 Fall 2013 Source: General Enrollment Webapp as of 08/27/2013 International graduate student enrollment Source: Certified Enrollment Data, Office of the Registrar 900 750 600 208 232 270 322 388 India Mexico 450 300 150 118 125 121 124 125 South Korea 34 30 25 33 36 26 36 35 29 Turkey 28 26 31 36 29 28 306 314 293 283 280 Fall 08 Fall 09 Fall 10 Fall 11 Fall 12 - 11 China Other Undergraduate/graduate student mix 7,000 1998 to 2013 2,638 6,000 40% 2,237 5,000 1,948 4,000 1,486 42% 41% 3,893 35% 3,000 2,782 2,000 65% 2,857 59% 3,102 60% 58% 1,000 0 12 Fall 1998 Source: Common Data Set Excludes students that are visiting or studying abroad Fall 2003 Undergraduates Fall 2008 Fall 2013* Graduate Students *Preliminary data per General Enrollment Webbapp downloads on 8/27/13 and 9/4/13 Research revenues FY13 up 6.4 percent from FY12 6% 10% 8% FY 2013 = $114,183,000 FY 2007 = $77,177,000 FY 2002 = $52,303,000 8% 11% 10% 14% 11% 14% +48% 17% +39% 13% 14% 14% 19% 30% 12% 13% 11% 31% 24% 10% DOD NIH NSF NASA + Other Federal Pass Throughs Foundations Other 13 *Other includes industry and state and local government sponsors Research awards: $130.3 million in FY 2013 Annual Awards $160,000,000 $140,000,000 $120,000,000 $100,000,000 $80,000,000 $60,000,000 $40,000,000 $20,000,000 $0 FY02 FY03 FY04 FY05 FY06 FY07 FY08 FY09 FY10 FY11 FY12 FY 13 14 Capital projects and plans: Moving west 15 Capital projects and plans: Moving west Projected completions • • • Anderson Clarke Center (January 2014) George R. Brown tennis facility (April 2014) Klein Hall Post 2015 (depending on fundraising) • Opera theater • Moody Center for the Arts • Football facility • Soccer and track pavilion Integrated campus planning study • • 16 Infrastructure: tunnels, roads, PARKING, storm water Impact of land development strategies Operating revenues FY 2013 FY 2003 $325.5M 17 +74% $565.2M Source: Rice Financial Statements for FY 2003 and preliminary FY 2013 Financial Statements Operating expenses FY 2013 FY 2003 6% Instruc on and department research Sponsored research 5% 9% Library 46% 10% Scholarships and fellowships Auxiliary enterprises Student services 1% 5% General administra on 18% $315.7M 18 +81% Ins tu onal development $569.9M Student services include athletics in FY 13 Source: Rice Financial Statements for FY 2003 and preliminary FY 2013 Financial Statements Growth of endowment ($ in billions) 19 Rice endowment returns 20 (as of June 30, 2013 - unaudited) Financial update Revenues • About 84 percent of operating revenues come from three sources: o Endowment distribution o Net tuition revenue o Grants and contracts Expenses • About 64 percent of operating expenses support instruction and departmental and sponsored research Bottom line • Triple AAA rating on bonds reaffirmed in 2013 • Tighter operating margins o Expenses growing faster than revenues 21 Centennial Campaign Goal exceeded: $1.1 billion raised • Endowments $106 million for scholarships and 28 new endowed professorships • New or expanded programs Asian studies, Jewish studies, urban research, religious tolerance, global health and leadership, undergraduate business minor, sociology, master of accounting • New research and classroom facilities Brockman Hall for Physics, biosciences, Klein Hall for Social Sciences, AndersonClarke Center for Continuing Studies and Moody Center for the Arts • Campus improvements Brochstein Pavilion, Gibbs Recreation and Wellness Center, Tudor Fieldhouse, James Turrell Skyspace and other art • New Colleges Duncan and McMurtry Colleges • Alumni giving rate 22 FY 2013: 31 percent Total campaign: 60 percent Campaign commitments by source as of June 30, 2013 23 Campaign commitments by type (dollars in millions) $1.1 billion as of 6/30/13 as of June 30, 2013 24 Priorities for the new century V2C PNC The application of the V2C to the first decade of our second century 25 Priorities for the new century Strategic academic priorities Campus infrastructure investments 26 Administrative effectiveness and efficiency Strategic academic priorities Enhancing research Quality teaching and digital learning Entrepreneurial university International engagement Second Century Arts initiative 27 Energy and environment TMC relations and biosciences Enhancing research New developments • Building corporate relationships • Improving administrative infrastructure o 60 percent of proposals submitted via the electronic proposal routing system o Reducing time from award to grant set up o Electronic labor redistribution • Creating SEA equipment endowment • Managing research space • Supporting center grant proposals 28 TMC relations New developments • Inter-institutional agreement with BCM under discussion • New TMC leadership and initiatives • Vice provost for strategic partnerships 29 Quality teaching New developments • Center for Teaching Excellence: Josh Eyler, director Fellows: Lisa Balabanlilar Steven Cox Reto Geiser Bridget Gorman Jane Grande-Allen Michael Gustin Jason Hafner Matthias Henze Rachel Kimbro Kathleen Matthews Albert Napier Marcia O’Malley Ann Saterbak Richard Stoll Robert Westbrook • Senate Committee on Teaching • Rice MOOCs for edX and Coursera • Rice’s Center for Digital Learning and Scholarship 30 How are we doing? Leiden Ranking: World’s top universities (2013) • • No. 1 in natural sciences and engineering No. 6 for all sciences US News & World Report (2014) • • Among top 20 national universities since 1988 Tied for No. 18 in 2014 ranking, down from No. 17 tie in 2013 Max Planck Society in Germany (2013) • • • • No. 1 for material sciences and chemistry No. 2 for engineering No. 4 physics and astronomy No. 8 in computer science Princeton Review (2014) (survey of students in 378 top universities) • No. 1 best quality of life • No. 2 happiest students • No. 3 best-run colleges • No. 5 great financial aid • No. 6 “their students love these colleges” • No. 10 best health services • No. 10 for lots of race/class interaction (only AAU school in top 10) • No. 12 best athletic facilities 31 RICE Responsibility, Integrity, Community, Excellence Values that define our culture and guide our behavior 32

