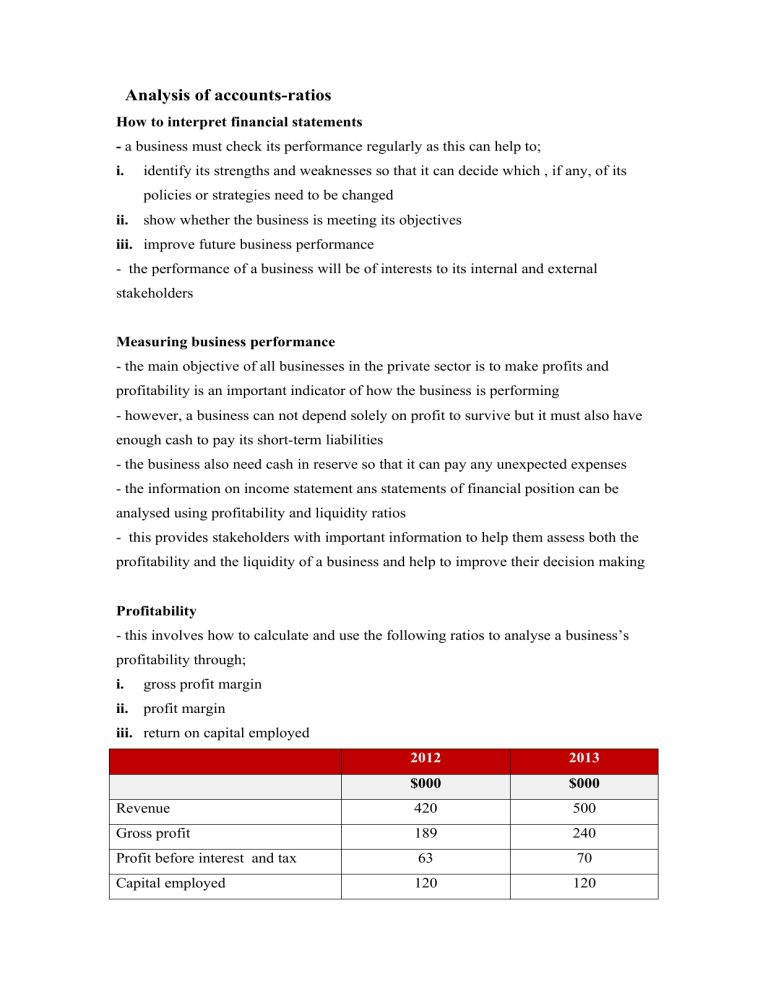
Analysis of accounts-ratios How to interpret financial statements - a business must check its performance regularly as this can help to; i. identify its strengths and weaknesses so that it can decide which , if any, of its policies or strategies need to be changed ii. show whether the business is meeting its objectives iii. improve future business performance - the performance of a business will be of interests to its internal and external stakeholders Measuring business performance - the main objective of all businesses in the private sector is to make profits and profitability is an important indicator of how the business is performing - however, a business can not depend solely on profit to survive but it must also have enough cash to pay its short-term liabilities - the business also need cash in reserve so that it can pay any unexpected expenses - the information on income statement ans statements of financial position can be analysed using profitability and liquidity ratios - this provides stakeholders with important information to help them assess both the profitability and the liquidity of a business and help to improve their decision making Profitability - this involves how to calculate and use the following ratios to analyse a business’s profitability through; i. gross profit margin ii. profit margin iii. return on capital employed 2012 2013 $000 $000 Revenue 420 500 Gross profit 189 240 Profit before interest and tax 63 70 Capital employed 120 120 Gross profit margin- is a ratio between gross profit and revenue.Gross profit margin ratios shows gross profit as a percentage of revenue. The ratio tells us how much gross profit is earned per $1 of revenue Gross profit margin (2012) = 푔푟� 푝푟� 푟푒푣푒 푒 189 � 100 420 � 100 = 45.5% * this result tells us that every $1 worth of goods sold the company made an average of $0.45 gross profit - a business can improve its gross profit margin by; a. increasing revenue without a similar increase in cost of sales - this may be achieved through an increase in price b. reducing cost of sales without a similar decrease in revenue- this can be achieved by buying cheaper supplies Profit margin- is a ratio between profit before tax and revenue - this shows profit as a percentage of revenue. Tells us how much profit is earned per $1 of revenue 푃푟� 푚푎푟푔 (ퟐퟎ ퟐ) = 63 � 100 420 푝푟� 푟푒푣푒 푒 � 100 = 15% * this result tells us that every $1 of revenue earned $0.15 of profit - this ratio measures the performance of the business in converting revenue into profit - since profit is the difference between revenue and total costs , it is; profit = revenue - (cost of sales + expenses) - to improve profit margin a business can; i. improve gross profit margin ii. reduce expenses - both profit margin and the gross profit margin can be used to measure how well the business adds value and control costs Adding value- selling a product for more than it cost to produce it - any improvements in the gross profit margin from one year to the next indicates improved added value - since profit before tax will always be lower than gross profit, it means the percentage profit margin will always be lower than the percentage gross profit margin - the difference between the two shows the effect of expenses on business profits Return on capital employed (ROCE)- is the ratio between profit before tax and capital employed. It is used to measure efficiency - it shows profit before tax as a percentage of capital employed. It tells how much profit is earned for every $1 invested in the business Capital employed- is the amount invested in the business by the owners. long term borrowing such as debentures, should also be included as capital employed - the money is usually borrowed to purchase profit earning assets such as buildings and machinery Return on capital (ퟐퟎ ퟐ) = 푝푟� 푐푎푝 푎 푒푚푝 �푒 63 � 100 120 � 100 = 52.5% * this measure tells us that every $1 of capital invested earned a return to the shareholders of $0.525.If it increases next it means the business is running efficiently Liquidity- is the ability of a business to pay its short term debts - if a business does not have enough cash to pay for its immediate expenses or short term liabilities (business debts), and has no access to cash from internal or external sources, it will not be able to continue trading - a business’s liquidity is its access to cash - current assets are important to a business because they indicate how much cash a business has access to in order to meet its short term liabilities - liquidity of a business can be monitored through the following ratios; a. current ratio b. acid test ratio 2012 2013 $000 $000 Current assets 60 50 Current assets-Inventories 20 30 Current liabilities 40 30 Current ratio- is the ratio between current assets and current liabilities 퐶푟푟푒 푟푎 � = 푐푟푟푒 푎 푐푟푟푒 푎푏 퐶푟푟푒 푟푎 �(2012) = 60 40 푒 푒 = 1.5:1 * it shows that for every $1 of current liabilities the business has $1.5 of current assets. - This means it has access to more cash than it needs to meet its short term liabilities and has spare cash to pay any unexpected expenses - as a general rule, i. the current ratio must be no less than 1.5:1, otherwise there is risk of running out of cash ii. should be no greater than 2:1, since it suggests that the business has too much cash tied up in unprofitable assets Acid test ratio illiquid- it means that assets are not easily convertible into cash - the main problem with the current ratio as a measure of liquidity is that some current assets are more difficult to turn into cash than others. - Inventories are the least liquid of the current assets because; a. the finished goods inventories have to be sold b. when they are sold on credit, the business has to wait for customers to pay - the acid test excludes inventories from current assets - it shows the most liquid current assets as a ration of current liabilities - for this reason acid test is considered to be a better measure of a business’s liquidity 퐴푐 푒 푟푎 � = (푐푟푟푒 푎 푒 − 푐푟푟푒 퐴푐 푒 푟푎 �(ퟐퟎ ퟐ) = 푎푏 푣푒 �푟 푒 ) 푒 (60 − 40) 40 =1:1 * an acid test of 1:1 is generally satisfactory, if it is lower than this there is a risk of the business not having enough cash to pay its short term liabilities - if it is too high then cash is being tied up in unprofitable assets Profitability vs Liquidity - profitability and liquidity are essential for the long term survival of any business, large or small - a business needs sufficient liquidity to be able to pay its debts, however it must also not keep large amounts of cash which could have been used more profitably e.g the cash could have been used to develop new products which could increase profitability Benefits and limitations of ratio analysis Benefits Limitations - users can compare ratios over time and identify - ratios compare past data. Users of accounts trends stakeholders - are much more interested in what the future holds for the business - users can compare results with similar businesses to - financial statements do not include all the strengths see how well a business is doing against competitors and weaknesses of a business, for example the quality and skills of employees. These factors are also likely to affect business performance, especially profitability - users can easily identify important information, such - income statements and statements of financial as profitability and liquidity, without having to look at positions are not always prepared in the same way by all of the financial statements different businesses. Therefore, the ratios do not compare like with like - businesses are affected by external factors- such as legislation, exchange rates and economic factors - but these will not be shown in the financial statements Why and how accounts are used - both internal and external stakeholders are interested in the financial statements of a business. The main uses of financial statements, Stakeholder Owner/ shareholders Uses - want to know whether they are getting a good return on their investment - they compare the dividends they received from the previous years with those of that current year and also the returns they might get if they have invested their money somewhere else Potential investors - interested in the profits of the business and the return that they might expect to receive from their investment Managers - want to know if financial objectives have been achieved e.g meeting revenue targets, how well costs have been controlled, are profits rising, - want to know how much has been retained in the business and how much is available to finance business activities such as purchase of machinery Employees - interested in the profitability of the business, since a business which makes more profits there will be high levels of job security - employees with the support of trade unions can use business figures to support their claim for higher wages Trade payables - suppliers will want to know if the business has sufficient cash to pay its debts when they become due or interested in the liquidity of the business - also want to know if there will be continuous supply of raw materials to the business, if it is making profits, which could be used for expansion purposes Lenders - banks and other lenders want to know that they will receive the interests on any money they have loaned to the business - also want to know if the business will be able t repay its borrowing when it becomes due Government - companies pay taxes on their profits. The higher the profits, the higher the tax revenue received by the government - a business which is doing well, will provide more employment and this will reduce the government spending on support for the unemployed Customers - they want to know that the business will continue to supply them with goods and services which meet their needs and wants Limitations of using Accounting ratios i. managers will have access to all accounting data but external users will only be able to use the published accounts which contain only data required by law ii. ratios are based past accounting data may not indicate how a business will perform in the future iii. accounting date over time will be affected by inflation (rising prices) and comparisons between years may be misleading iv. different companies may use slightly different accounting methods e.g valuing their fixed assets, and these differences may lead to different ratio results amking comparisons difficult Interpreting financial statements


