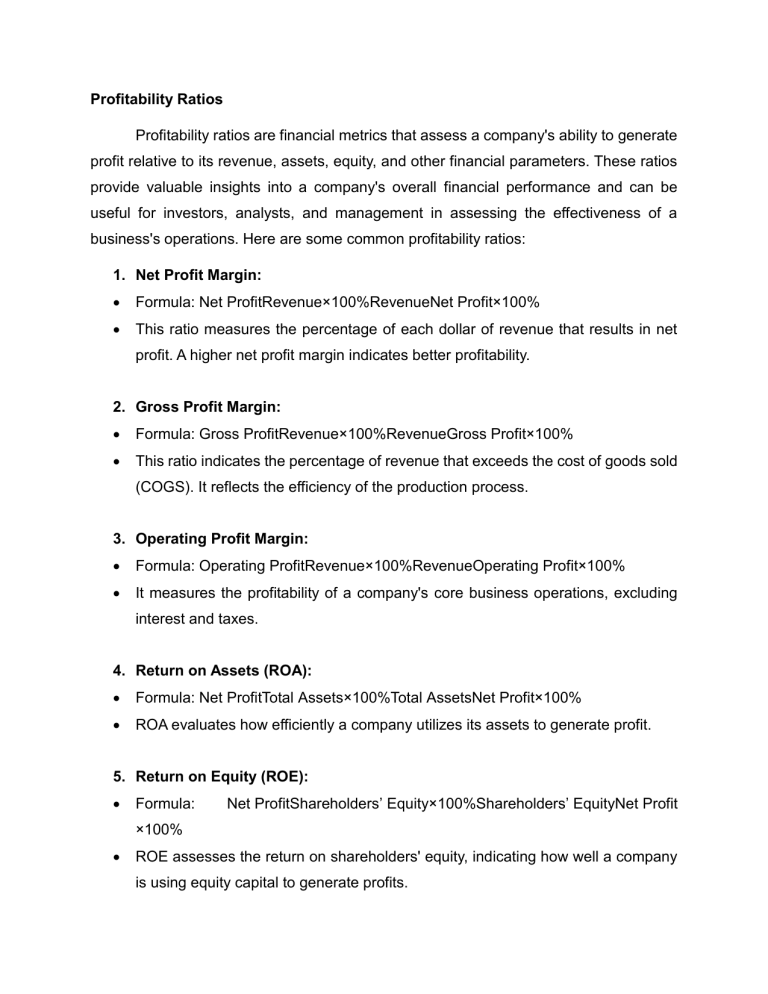
Profitability Ratios Profitability ratios are financial metrics that assess a company's ability to generate profit relative to its revenue, assets, equity, and other financial parameters. These ratios provide valuable insights into a company's overall financial performance and can be useful for investors, analysts, and management in assessing the effectiveness of a business's operations. Here are some common profitability ratios: 1. Net Profit Margin: Formula: Net ProfitRevenue×100%RevenueNet Profit×100% This ratio measures the percentage of each dollar of revenue that results in net profit. A higher net profit margin indicates better profitability. 2. Gross Profit Margin: Formula: Gross ProfitRevenue×100%RevenueGross Profit×100% This ratio indicates the percentage of revenue that exceeds the cost of goods sold (COGS). It reflects the efficiency of the production process. 3. Operating Profit Margin: Formula: Operating ProfitRevenue×100%RevenueOperating Profit×100% It measures the profitability of a company's core business operations, excluding interest and taxes. 4. Return on Assets (ROA): Formula: Net ProfitTotal Assets×100%Total AssetsNet Profit×100% ROA evaluates how efficiently a company utilizes its assets to generate profit. 5. Return on Equity (ROE): Formula: Net ProfitShareholders’ Equity×100%Shareholders’ EquityNet Profit ×100% ROE assesses the return on shareholders' equity, indicating how well a company is using equity capital to generate profits. 6. Earnings per Share (EPS): Formula: Net ProfitNumber of Outstanding SharesNumber of Outstanding SharesNet Profit EPS represents the portion of a company's profit allocated to each outstanding share of common stock. 7. Cash Flow Margin Formula:(Operating Cash FlowNet Sales)×100Cash Flow Margin=(Net SalesOpe rating Cash Flow)×100 The cash flow margin is a profitability ratio that measures the percentage of a company's sales or revenue that turns into cash after covering the cost of goods sold (COGS) and operating expenses. 8. Dividend Payout Formula =(Net IncomeDividends Paid)×100 The dividend payout ratio is a financial metric that indicates the proportion of a company's earnings that is distributed to shareholders in the form of dividends. 9. Dividend Yield Formula= (Stock Price per ShareAnnual Dividends per Share)×100 Dividend yield is a financial ratio that measures the annual dividend income an investor can expect to receive relative to the current market price of a stock. 10. Dividends per share Formula= Number of Outstanding SharesTotal Dividends Paid Dividends per share (DPS) is a financial metric that represents the total amount of cash or stock dividends declared by a company and distributed to its shareholders on a per-share basis.


