Financial Statement Analysis: Horizontal & Vertical Analysis
advertisement
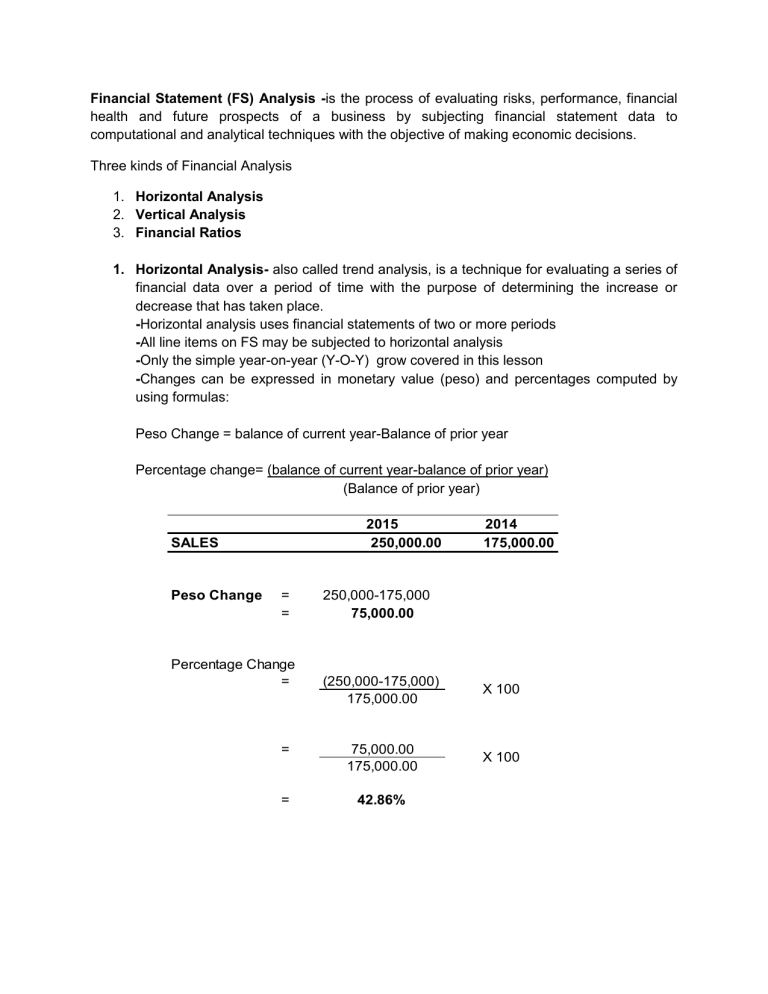
Financial Statement (FS) Analysis -is the process of evaluating risks, performance, financial health and future prospects of a business by subjecting financial statement data to computational and analytical techniques with the objective of making economic decisions. Three kinds of Financial Analysis 1. Horizontal Analysis 2. Vertical Analysis 3. Financial Ratios 1. Horizontal Analysis- also called trend analysis, is a technique for evaluating a series of financial data over a period of time with the purpose of determining the increase or decrease that has taken place. -Horizontal analysis uses financial statements of two or more periods -All line items on FS may be subjected to horizontal analysis -Only the simple year-on-year (Y-O-Y) grow covered in this lesson -Changes can be expressed in monetary value (peso) and percentages computed by using formulas: Peso Change = balance of current year-Balance of prior year Percentage change= (balance of current year-balance of prior year) (Balance of prior year) 2015 250,000.00 SALES Peso Change = = Percentage Change = 2014 175,000.00 250,000-175,000 75,000.00 (250,000-175,000) 175,000.00 X 100 = 75,000.00 175,000.00 X 100 = 42.86% Vertical Analysis- also called common-size analysis, is a technique that expresses each financial statement item as percentage of base amount -For Statement of Financial Position, the base amount is Total Assets. -Balance of account/ Total Assets -From the common-size Statement of Financial Position, the analyst can infer the composition of asset and the company’s financing mix. Example: Cash Accounts Receivable Inventory Equipment Total Assets 200,000.00 400,000.00 250,000.00 550,000.00 1,400,000.00 % of Asset 14.29% 28.57% 17.86% 39.29% 100.00% Accounts Payable Notes Payable Owners Capital Total Liabilities & OE 300,000.00 400,000.00 700,000.00 1,400,000.00 21.43% 28.57% 50.00% 100.00% Analysis: The largest component of asset is Equipment at 39.29%. Cash is the smallest component at 14%. On the other hand, 50% of assets are financed by debt and the other half is financed by equity. -For Statement of comprehensive Income, the base amount is Net Sales. -Balance of account/Total Sales -This will reveal how “Net Sales” is used up by the various expenses -Net Income as a percentage of sales is also known as the net profit margin. Example: % of Net Sales Net Sales Cost of Good Sold Gross Profit Operating Expenses Net Income 900,000.00 400,000.00 500,000.00 200,000.00 300,000.00 44.44% 55.56% 22.22% 33.33% Analysis: -Cost of goods sold is 44% of sales. The company has a gross profit rate of 55.56% Operating expenses is 22% of sales. -The company earns income of P.33 for every peso of sale. Gross profit generated for every peso sale is P.55
