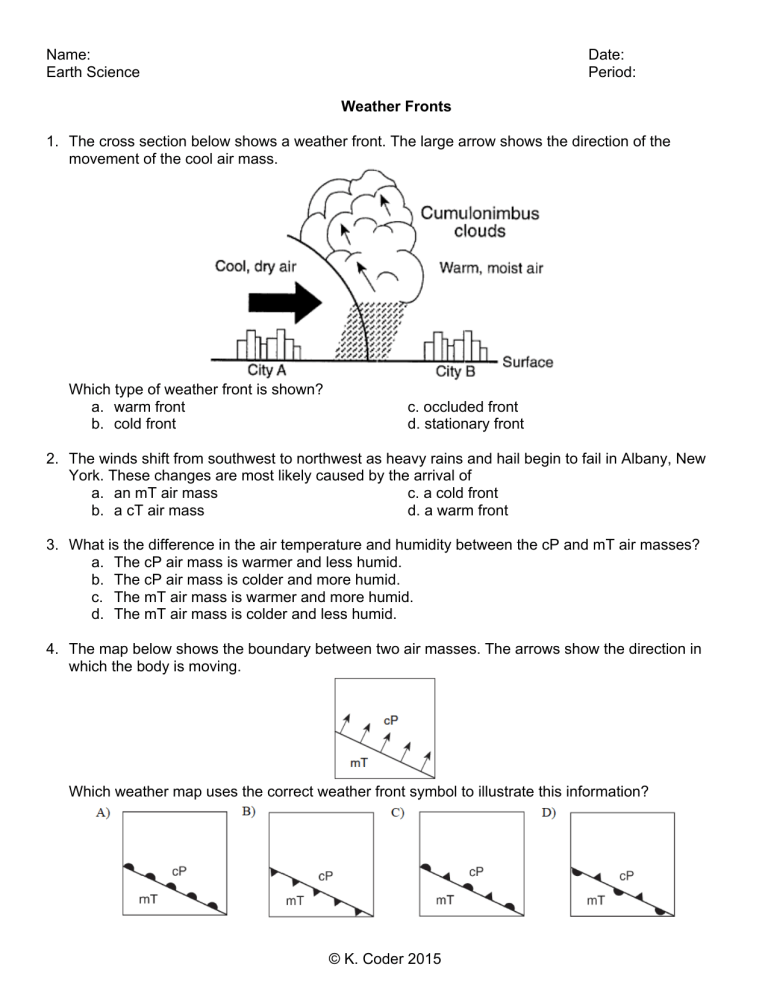
Name: Earth Science Date: Period: Weather Fronts 1. The cross section below shows a weather front. The large arrow shows the direction of the movement of the cool air mass. Which type of weather front is shown? a. warm front b. cold front c. occluded front d. stationary front 2. The winds shift from southwest to northwest as heavy rains and hail begin to fail in Albany, New York. These changes are most likely caused by the arrival of a. an mT air mass c. a cold front b. a cT air mass d. a warm front 3. What is the difference in the air temperature and humidity between the cP and mT air masses? a. The cP air mass is warmer and less humid. b. The cP air mass is colder and more humid. c. The mT air mass is warmer and more humid. d. The mT air mass is colder and less humid. 4. The map below shows the boundary between two air masses. The arrows show the direction in which the body is moving. Which weather map uses the correct weather front symbol to illustrate this information? © K. Coder 2015 Base your answers to questions 5 and 6 on the diagram below, which shows the frontal boundary between mT and cP air masses. 5. If the front at ground level is moving toward city B, which type of weather front is shown? a. cold front c. occluded front b. warm front d. stationary front 6. Why do clouds and precipitation usually occur along the frontal surface? a. The warm air rises, expands, and cools. b. The warm air sinks, expands, and warms. c. The cool air rises, compresses, and cools. d. The cool air sinks, compresses, and warms. 7. The map below shows high-pressure and low-pressure weather systems in the United States. Which two lettered positions on the map are most likely receiving precipitation? a. A and B c. C and E b. B and D d. A and D © K. Coder 2015 Base your answers to questions 8 and 9 on the diagram below which represents a cross section of a weather front is shown below. 8. The cloud formation and precipitation shown in the cross section are caused by a. cold air rising and warming b. cold air sinking and warming c. warm air rising and cooling d. warm air sinking and cooling 9. Which symbol would be used to represent this front on a weather map? 10. The weather map below shows a portion of the United States. Line AB represents a frontal boundary between two air masses. The two large arrows indicated the direction that a cP air mass is moving. Which symbol correctly represents the frontal boundary at line AB? © K. Coder 2015 Base your answers to questions 11 through 13 on the cross section below, which shows a typical cold front moving over New York State in early summer. 11. Explain why the warm, moist air is rising at the frontal boundary. 12. State one process that causes clouds to form in this rising air. 13. Central Canada was the geographic source region for the cP air mass shown in the cross section. Identify the most likely geographic source region for the mT air mass shown in the cross section. © K. Coder 2015 Base your answers to questions 14 through 16 on the weather map below, which shows a highpressure center (H) and a low-pressure center (L), with two fronts extending from the low-pressure center. Points X and Y are locations on the map connected by a reference line. 14. Which type of front is located between Buffalo and Detroit? a. stationary b. warm c. occluded d. cold 15. Which cross section best represents the fronts and air movements in the lower atmosphere along line XY? 16. Which map best shows the most probably areas of precipitation associated with these weather systems? © K. Coder 2015 Base your answers to questions 17 through 21 on the diagram below, which shows air masses, clouds and rain associated with two fronts that are influencing weather conditions in New York State. Letters A, B, and C represent three air masses. The arrows show the direction of air and front movements. 17. Identify the most likely geographic source region for air mass A. 18. Identify the most likely geographic source region for air mass B. 19. Identify the type of front shown between air mass A and air mass B. 20. Identify the type of front shown between air mass B and air mass C. 21. Identify one process that causes clouds to form in the air rising along the frontal surface between air mass A and air mass B. © K. Coder 2015 Base your answers to questions 22 through 24 on the weather map below. The weather map shows a low-pressure system in New York State during July. The L represents the center of the low-pressure system. Two fronts extend from the center of the low. Line XY on the map is a reference line. 22. The cross section below shows a side view of the area along line XY on the map. On lines 1 and 2 in the cross section, place the appropriate two-letter air mass symbols to identify the most likely type of air mass at each of these locations. 23. The forecast for one city located on the map is given below: “In the next hour, skies will become cloud covered. Heavy rains are expected with possible lightening and thunder. Temperatures will become much cooler.” State the name of the city for which this forecast was given. 24. Identify one action that people should take to protect themselves from lightning. © K. Coder 2015 Base your answers to questions 25 through 27 on the weather map provided below. The weather map shows a low-pressure system over part of North America. Five weather stations are shown on the map. Lines AB, BC, and BD represent surface frontal boundaries. Line AB represents an occluded front that marks the center of a low-pressure system. Symbols cP and mT represent different air masses. 25. On the weather map below, place the proper front symbols on lines AB, BC, and BD. Place the front symbols on the correct side of each line to show the direction of front movement. 26. Name the geographic region over which the mT air mass most likely formed. 27. Other than low pressure, state two weather conditions associated with a low-pressure center. © K. Coder 2015
