First Order PMD-Compensation in a 10 Gbit/s NRZ Field Experiment
advertisement

First Order PMD-Compensation in a 10 Gbit/s
NRZ Field Experiment Using a Polarimetric
Feedback-Signal
H. Rosenfeldt, R. Ulrich (1), U. Feiste, R. Ludwig, H.G.Weber (2), A. Ehrhardt (3)
(1) Technische Universitaet Hamburg-Harburg FSP 2-03 Optik und Messtechnik, D-21073 Hamburg, Germany
(rosenfeldt@tu-harburg.de)
(2) Heinrich-Hertz-Institut Berlin GmbH, Einsteinufer 37, D-10587 Berlin, Germany (ludwig@hhi.de)
(3) Deutsche Telekom AG, Goslarer Ufer 35, D-10589 Berlin, Germany
Abstract:We demonstrate PMD-compensation of an installed high-PMD fiber (∆τ=80.5ps, L=45 km) by means of a
variable delayline and a set of polarization controllers. The compensation-algorithm minimizes a feedback-signal
derived by a frequency-resolving stokes-polarimeter.
Introduction
Experimental Setup
Automatic first-order compensation of polarization mode
dispersion (PMD) has been a topic of many recent
publications [1,2,3]. The typical approach in these
investigations is to split the distorted signal into the two
principal states of polarization (PSP), the slow and fast
eigenstate. The fast eigenstate is then delayed before the
two signals are recombined [1]. Since the polarization of
the delayline input signal and the delay have to be adjusted
to an optimum, a feedback-signal is needed. It is desirable
to derive this feedback-signal directly from the optical
signal without modifying the receiver. In the present paper,
we describe a 10 Gbit/s NRZ transmission experiment over
45 km standard singlemode fiber (SMF) which is
embedded in the city of Berlin. This fiber has a very high
PMD value of 80.5 ps with maximum differential group
delay (DGD) values up to 150 ps. We demonstrate the
PMD compensation using a variable delayline and a set of
polarization controllers [1]. A compensation algorithm is
used to minimize the frequency dependence of the state of
polarization (SOP).
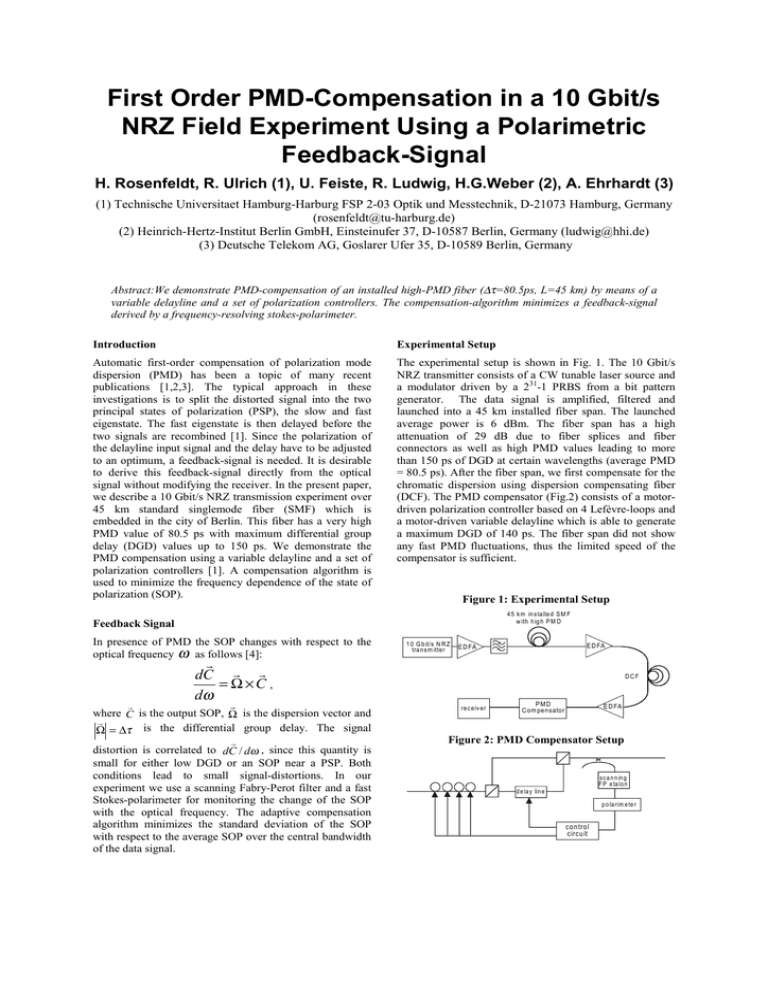
The experimental setup is shown in Fig. 1. The 10 Gbit/s
NRZ transmitter consists of a CW tunable laser source and
a modulator driven by a 231-1 PRBS from a bit pattern
generator. The data signal is amplified, filtered and
launched into a 45 km installed fiber span. The launched
average power is 6 dBm. The fiber span has a high
attenuation of 29 dB due to fiber splices and fiber
connectors as well as high PMD values leading to more
than 150 ps of DGD at certain wavelengths (average PMD
= 80.5 ps). After the fiber span, we first compensate for the
chromatic dispersion using dispersion compensating fiber
(DCF). The PMD compensator (Fig.2) consists of a motordriven polarization controller based on 4 Lefèvre-loops and
a motor-driven variable delayline which is able to generate
a maximum DGD of 140 ps. The fiber span did not show
any fast PMD fluctuations, thus the limited speed of the
compensator is sufficient.
Figure 1: Experimental Setup
4 5 km in stalle d S M F
w ith h ig h P M D
Feedback Signal
In presence of PMD the SOP changes with respect to the
optical frequency ω as follows [4]:
&
1 0 G b it/s N R Z
tra nsm itter
dC = Ω ×C ,
dω
&
where C is the output SOP, Ω is the dispersion vector and
&
Ω = ∆τ is the differential group delay. The signal
&
distortion is correlated to dC / dω , since this quantity is
small for either low DGD or an SOP near a PSP. Both
conditions lead to small signal-distortions. In our
experiment we use a scanning Fabry-Perot filter and a fast
Stokes-polarimeter for monitoring the change of the SOP
with the optical frequency. The adaptive compensation
algorithm minimizes the standard deviation of the SOP
with respect to the average SOP over the central bandwidth
of the data signal.
E D FA
E D FA
DCF
receiv er
PMD
C om pensator
E D FA
Figure 2: PMD Compensator Setup
s c a n n in g
F P e ta lo n
d e la y lin e
p o la rim e te r
co n tro l
circu it
Figure 5: Correlation between feedback signal and BER
at constant receiver input power λ=1550.14 nm,
∆τ=60ps
0.2
Feedback
However, for practical applications a compensator should
be able to track fast PMD-changes induced for example by
moving patchchords [5]. The Fabry-Perot etalon has a free
spectral range of 50 GHz and a finesse of 40 which leads to
a spectral resolution of 1.25 GHz. The scanning period of
the filter is 20 ms.
Experimental Results
First we measured the wavelength dependence of the DGD
of the investigated fiber span. The results are given in
figure 3. The DGD varies from less than 25 ps to more than
150 ps. The operating wavelength was 1550.14 nm where
the DGD is about 60 ps.
0.15
0.1
0.05
0
0
20
40
60
Compensator DGD [ps]
80
100
20
40
60
Compensator DGD [ps]
80
100
log(BER)
-2
Figure 3: Measured wavelength dependence of total
DGD of 45km installed SMF-fiber
-4
-6
-8
0
1fW 474 !"`cCABD[] 1fW d_dQ\ 474 ( %`c
D_dQ\ 474 `c
$#('']\ 363
Figure 6 shows the eye diagrams for a different wavelength
at the transmission fiber input (a), at the input of the PMDcompensator for the worst input SOP (b) and finally behind
the PMD-compensator (c). It is evident that no signal
detection is possible without PMD-compensator. A good
eye-opening is achieved after PMD compensation.
1Ta[X]
!]S >_TaPcX]V FPeT[T]VcW
!&
778
"_b
50
>EBc'"
!"
(
Figure 6: Eye diagrams at fiber input (a), compensator
input (b) and after compensation (c). λ=1549.88 nm,
∆τ=130 ps.
$
bc >_TaPcX]V FPeT[T]VcW
$$
!%$(
#]\ 363 %_b
!%%
!%%"
GQfU\U^WdX ^]
Figure 4 depicts BER measurements versus the receiver
input power for back-to-back measurements, for a
transmission over 50 km high-quality standard fiber with
negligible PMD ( PMD < 0.05 ps / km ), and finally for the
PMD-compensated transmission line. Due to the signal
degradation without PMD compensation no BER
measurements could be performed. With PMD
compensation error-free transmission was possible with a
penalty of 2dB. The good correlation between the BER
values at constant receiver input power and the standard
deviation of the SOP with respect to the average SOP is
shown in Figure 5.
Figure 4: BER performance λ=1550.14 nm, ∆τ=60 ps.
4
back-to-back
reference span
(without PMD compensation)
installed fiber
and PMD compensation
5
Conclusion
We demonstrated the operation of a PMD-compensator in a
10 Gbit/s NRZ transmission experiment over 45 km of
installed standard fiber with high PMD value. The PMD
compensator minimizes the standard deviation of the SOP
with respect to the average SOP. A good correlation
between these standard deviations of the SOP and the BER
values was obtained.
/1/
/2/
-log(BER)
/3/
6
/4/
7
/5/
8
9
10
-40
-35
receiver input power (dBm)
-30
F. Heismann et al., Proc. ECOC'98, Madrid (Spain),
Vol 1, p. 529-530, (1998)
R. Noé et al., Proc. ECOC'98, Madrid (Spain), Vol 3,
p. 157-158, (1998)
H. Bülow, Proc. OFC’99, San Diego (USA), WE1-1
p. 74-76, (1999)
D. Andresciani et al., Opt. Lett. 12(10) p. 844-846,
(1987)
H. Bülow et al., Proc. OFC’99, San Diego (USA),
WE4-1 p. 83-85, (1999)


