Agric. sci. dev., Vol(3), No (2), February, 2014. pp. 183-187
TI Journals
ISSN:
Agriculture Science Developments
2306-7527
www.tijournals.com
Copyright © 2014. All rights reserved for TI Journals.
The Production Function of Iran Agricultural Sector
Farshad Sameni Keivani *
Department of Accounting, Roudsar and Amlash Branch, Islamic Azad University, Roudsar, Iran
Ali Bidarian
Department of Accounting, the University of Guilan, Rasht, Iran
Mousa Najibi
Department of Management, Qazvin Branch, Islamic Azad University, Qazvin, Iran
Ramtin Safabakhsh Ghasemi
Department of Management, Qazvin Branch, Islamic Azad University, Qazvin, Iran
*Corresponding author: farshadsameni@yahoo.com
Keywords
Abstract
Agricultural Sector
Production Function
Iran
First of all, the paper provides the background of production function and the situation of agriculture sector
of Iran. This survey determines the production function of the agricultural sector in Iran. The data which is
used in this study concerned to during 1986 to 2010. The website of Central Bank is the source of taking of
data. EVIEWS8 and SPSS software assists the study to estimate the production function of agricultural
sector by OLS method in a way of the linear function. The findings of the paper show in the short run during
the years of the study the coefficients of the labor and the real capital in Iran are -0.349610 and 4.332734,
respectively. But the coefficient of labor isn’t statistically significant. However, the coefficient of capital is
statistically significant. So, the quantity of output in agriculture sector in Iran increases 4.332734 units if the
capital in this sector increases one unit. It is so important to teach the workers, in this sector, who produce
with full efficiency.
1.
Introduction
A production function, in economics, shows the relationship between quantity of output and factors of production. It almost i ndicates by a
mathematical method which shows the maximum quantity of a product that can be derived from a specified number of inpu ts, generally, labor
and capital. Hence, the production function, explains from each feasible combination of inputs how much output in the best si tuation can be
achieved.
According to Iran's economic structure and the relationship among the agriculture and other sectors of the Iran economy, it is so important to
invest in the Iran agriculture sector. On the other side, the agricultural activities usually occur in the rural areas so investing in agriculture sector
causes decreasing of unemployment rate in rural areas and to avoid emigration of the villagers to the cities [8, 29, 30 and 31].
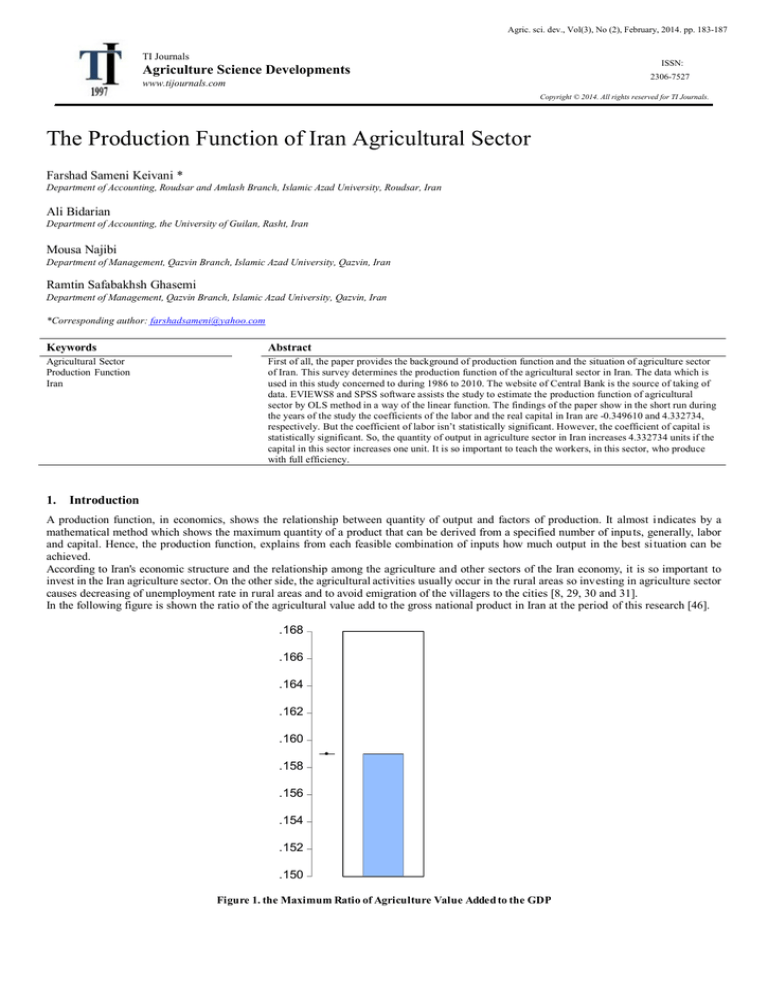
In the following figure is shown the ratio of the agricultural value add to the gross national product in Iran at the period of this research [46].
.168
.166
.164
.162
.160
.158
.156
.154
.152
.150
Figure 1. the Maximum Ratio of Agriculture Value Added to the GDP
Farshad Sameni Keivani *, Ali Bidarian, Mousa Najibi, Ramtin Safabakhsh Ghasemi
184
Agriculture Science Developments Vol(3), No (2), February, 2014.
As we can see at the above figure, the ratio of the Iran agriculture value added has not been more than 0.16 percent in the period of the study.
According to importance of agriculture in the economic development and the economic structure of Iran the trends is not appropriate. The ratio
of the value added of agriculture respect to industry sectors in Iran show at the following figure in during of study years i n Iran other papers on
this subject include [32- 41]
1.8
1.6
1.4
1.2
1.0
0.8
0.6
0.4
86
88
90
92
94
96
98
00
02
04
06
08
10
Figure.2: the Ratio of Agriculture respect to Industry sectors in Iran
As we can see at the above figure, the ratio of the value added of agriculture respect to industry sectors in Iran is reduced over the time.
The production curves of TPL, MPL and APL in generally can be drawn as follows:
Figure.3: The production curves of TPL, MPL and APL
B
TPL
A
TPL
C
O
L1 L2
L
L3
APL
L
MPL
Many papers in economics to analyze firms behaviors assumes that production functions of firms are in form of the Cobb-Douglas production
function which first introduced by Charles Cobb and Paul Douglas [3,5,6 and9]. It is written as follow:
Q =F (L, K) = ALα1Kα2
Where, A, α1 and α2 are parameters. In this function, α 1 and α2 show the production elasticity of labor and capital, respectively. In this form, the
marginal product of labor can be estimated as the following equation [1, 2 and 4]:
MPL = α1ALα1-1Kα2
And the marginal product of capital is obtained as follow:
MPK = α2ALα1 Kα2-1
Hence, the marginal rate of technical substitution between labor and capital, MRTS LK,is:
MRTSLK = (α1/ α2) (K/L)
185
The Production Function of Iran Agricultural Sector
Agriculture Science Developments Vol(3), No (2), February, 2014.
The main aim of the study is to determine the production function of agriculture sector in Iran. Determination of this functi on will help the Iran
agriculture decision makers to take a good decision to reduce extra costs and increase productivity in this sector.
The main hypotheses in the study are as follow:
1. There is a significant relationship, during period 1986 to 2110, between labor and agriculture output in Iran.
2. There is a significant relationship, during period 1986 to 2110, between capital with one period lag and agriculture output i n Iran.
Hence, the main questions can be indicated as follow:
1. Is there is a significant relationship, during period 1986 to 2110, between labor and agriculture output in Iran?
2. Is there a significant relationship, during period 1986 to 2110, between capital with one period lag and agriculture output i n Iran
2.
Methodology
First of all, the paper provides the background of production function and the situation of agriculture sector of Iran. Achieving the aim
theoretical discussions and empirical studies was conducted using library methods. The required data, the related background information on
empirical studiers and literature was collected by internet and library ways. The statistical data are taken from statistical data of Ce ntral Bank of
Iran. After collecting the secondary data, it is necessary to determine to be or not to be the stationary for the data. Unit root test of Augmented
Dickey-Fuller (ADF) is applied for it. Then is used the linear function representing the relationship between the agricultural sector value add of
Iran as a dependent variable and its factors of production, labor and capital, as the independents variables other papers on this subject include
[12- 28]. The linear function which is used in this study is as follows:
Q = f (L, K-1)
Where:
Q = the agricultural sector value added in Iran
L = the number of employees in the agricultural sector in Iran.
K-1= the capital stock in the agricultural sector in Iran with one lag period.
In this survey, the linear model is qiven as follows:
Q = α0 + α1 L + α2 K-1
Where the dependent variable is Q, the agricultural sector value added in Iran, and independent variables are L, the number of employees in the
agricultural sector in Iran, and K-1 is the capital stock in the agricultural sector in Iran with one lag period. The study used the data that is derived
from Economics Time Series Database of Central Bank of Iran from 1986 to 2110.
Hence, the linear regression model can be used to estimate the production function in this research. The statistical population limits to Iran
economy. The studied variables in this study are annual time series data mainly from 1986 to 2010. The study applies EIEWS8 and SPSS
Software. Final, using appropriate statistical analyzes investigate significant of the model and coefficients.
3.
Results and Discussion
First of all, it is necessary to check the time series data is stationary or not which it can be provided in some ways using EVIEWS8 or other
software. One of all is Unit root test of Augmented Dickey-Fuller (ADF) which is used by this survey. Due to the results of the ADF test, at 5%
confidence level, all of the data are not stationary at the level but only the natural logarithm of capital is stationary at the level and the other
variables in the natural logarithm of the variables are stationary at the first difference. In other words, however the Q and L variables have unit
root test at the level but have not unit root test while the natural logarithm of the variables are used in the Cobb Douglas function [7, 10, 43, 44
and 45].
The ADF test results are as come at the following table:
Table1. The results of ADF test
The names of
variables
ADF statistics
The Critical
Value at 5%
Q
-6.394842
-3.622033
K-1
-4392150
Ln(L)
-4.468947
-3.622033
-3.622033
The Stationary
at
Prob.
1st difference
0.0001
1st difference
0.0105
1st difference
0.0089
In order to estimate the relationship between the production of agriculture sector and the effectives variables in Iran are applied the linear
regression model. The function coefficients can be found from the below table [42 and 43]:
Table2. Coefficients of Model
Farshad Sameni Keivani *, Ali Bidarian, Mousa Najibi, Ramtin Safabakhsh Ghasemi
186
Agriculture Science Developments Vol(3), No (2), February, 2014.
Dependent Variable: the agricultural sector value added
Method: Least Squares
Sample (adjusted): 1987 2010
Included observations: 24 after adjustments
Variable
Coefficient
Std. Error
t-Statistic
Prob.
C
L
K-1
34880.22
-0.349610
4.332734
2362.079
3.090358
0.534078
14.76674
-0.113129
8.112550
0.0000
0.9110
0.0000
R-squared
Adjusted R-squared
S.E. of regression
Sum squared resid
Log likelihood
F-statistic
Prob(F-statistic)
0.758218
0.735191
6166.941
7.99E+08
-241.8991
32.92748
0.000000
Mean dependent var
S.D. dependent var
Akaike info criterion
Schwarz criterion
Hannan-Quinn criter.
Durbin-Watson stat
46617.30
11984.04
20.40826
20.55552
20.44733
1.390500
And for this model we can write as follow:
Substituted Coefficients:
=========================
Q = 34880.22 +-0.349610*L + 4.332734*K
According to the results of the paper we can tell, in the model, the coefficients of the number of employees in the agricultural sector in Iran and
the capital stock in that sector are -0.349610 and 4.332734, respectively. Due to the information of above table α 1 is not significant at %5
confidence level. But the coefficient of capital, α2, is statistically significant. So, the quantity of output in agriculture sector in Iran increases
4.332734 units if the capital in this sector increases one unit.
Due to ANOVA test, the coefficients of the variables are also statistically significant (see the ANOVA table as the follow):
Table 3. ANOVAa
Model
Regression
1
Residual
Total
Sum of Squares
df
Mean Square
F
Sig.
2504540217.240
2
1252270108.620
32.927
.000b
798654266.729
21
38031155.559
3303194483.970
23
a. Dependent Variable: Q
b. Predictors: (Constant), k, l
Due to the ANOVA data in table 3, the Sig is near to zero so the correlations are significant among the agricultural sector value added and the
independent variables also the t-test statistic confirms it and also the value of R-Square is enough big which indicates the contribution of the L
and the K on the agricultural sector value added of Iran is 0.758218%. The closeness of R2 and Adj-R2, 0.735191%, shows the Goodness of fit
of data. Generally, one of hypotheses is accepted and the other is rejected means that:
1. There is not a significant relationship, during period 1986 to 2110, between labor and agriculture output in Iran.
2. There is a significant relationship, during period 1986 to 2110, between capital with one period lag and agriculture output in Iran.
The coefficient of the labor is not significant in this survey because most of workers in the agriculture sector in Iran are unskilled so the
efficiency of them is low and also the ratio of labor with respect to capital is high.
4.
Conclusions
This paper determines with using linear method by applying SPSS and Eviews8 Software, the production function in agricultural sector of Iran
covering data 1986 to 2110 which has been taken from the website of Central Bank of Iran. This paper examines the changes in the production
factors how much effect on the change in the agricultural sector value added in Iran. The results of the study show that increasing capital in the
agriculture sector causes to increase the agricultural sector value added. So the agriculture sector in Iran needs to support the Iran government
more than the past. However, according to the findings there is not a significant relationship between labor and agriculture output in Iran. It is
so important to teach the workers, in this sector, who produce with full efficiency.
References
[1]
Balakrishnan P and Pushpangadan K (1994), “Total Factor Productivity Growth in Manufacturing Industry: A Fresh Look”, Economic and Political
Weekly, Vol. 29, pp. 2028-2035.
187
The Production Function of Iran Agricultural Sector
Agriculture Science Developments Vol(3), No (2), February, 2014.
[2]
[3]
[4]
[5]
[6]
[7]
[8]
[9]
[10]
[11]
[12]
[13]
[14]
[15]
[16]
[17]
[18]
[19]
[20]
[21]
[22]
[23]
[24]
[25]
[26]
[27]
[28]
[29]
[30]
[31]
[32]
[33]
[34]
[35]
[36]
[37]
[38]
[39]
[40]
[41]
[42]
[43]
[44]
[45]
[46]
Banerji A (1971), “Productivity Growth and Factor Substitution in Indian Manufacturing”, Indian Economic Review, Vol. 6, No. 1, pp. 1-23.
Burness HS, Quirk JP (1999) Appropriative water rights and the efficient allocation of resources. Am Econ Rev 69:25–37
Berndt E R and Christensen L R (1973), “The Translog Function and the Substitution of Equipment, Structures, and Labor in US Manufacturing 192968”, Journal of Econometrics, Vol. 1, pp. 81-114.
Berndt Ernst R and Wood David O (1975), “Technology, Prices, and the Derived Demand for Energy”, The Review of Economics and Statistics, Vol.
57, No. 3, pp. 259-268, MIT Press.
Connor, M. (1994). Northern America as a Precursor of Changes in Western European Food Purchasing Patterns, European Review o f Agricultural
Economics, 21:155-73.
Cox, D., and H. Miller (1965), the Theory of Stochastic Processes, John Wiley, NY.
Caswell M, Lichtenberg E, Zilberman D (1990) the effect of policies on water conservation and drainage. Am J Agric Econ 72: 8 83–890
Chakravorty U, Hochman E, Zilberman D (1995) A spatial model of optimal water conveyance. J Environ Econ Manag 29:25–41
Dickey D A and Fuller W A (1981), “Likelihood Ratio Statistics for Auto-Regressive Time Series with a Unit Root”, Econometrica, Vol. 107, No. 1,
pp. 1057-1078
Djitte N, Ekeland I (2006), an inverse problem in the economic theory of demand. Annales de l’Institut Henri Poincare´ (C) Nonlinear Anal 23(2):269–
281
Durlauf, S., and D. Quah (1999), the New Empirics of Economic Growth. In Taylor J., and Woodford, M. (eds.) Handbook of Macro economics.
Elsevier Science
Diewert W E (1971), “An Application of the Shephard Duality Theorem: A Generalized Leontief Production Function”, Journal of Political Economy,
Vol. 79, May-June, pp. 481-507.
Engle R F and Granger C W J (1987), “Cointegration and Error Correction: Representation, Estimation and Testing”, Econometrica, Vol. 55. No. 2, pp.
251-276
Hoch, Irving, Simultaneous Equation Bias in the Context of the Cobb-Douglas Production Function, Econometrica, 26 (October, 1958), 566-578
Goldar B N (1986), Productivity Growth in Indian Industry, Allied Publishers Private Limited, New Delhi.
Greene W H (1980), “Maximum Likelihood Estimation of Econometric Frontier Functions”, Journal of Econometrics, Vol. 13, No. 1 .
Gupta Deepak (1985), “Productivity Trends and Factor Substitutability in Manufacturing Sector in Maharashtra”, Margin, July, pp. 62 -69.
Garrido R (2005) Price setting for water use charges in Brazil. Water Resour Dev 21(1):99–117
Greene WH (2002) LIMDEP version 8.0 econometric modeling guide. Econometric Software Inc., New York
Jorgenson and Griliches (1967), “The Explanation of Productivity Change”, Review of Economic Studies, July.
Little I M D, Mazumdar D and Page Jr. J M (1987), Small Manufacturing Enterprises: A Comparative Analysis of Indian and Other Economies,
Published for the World Bank by Oxford University Press, Washington.
Lynk L Edward (1982), “Factor Demand Substitution and Biased Technical Change in Indian Industry”, The Manchester School of E conomic & Social
Studies , Vol. 50, No. 2, pp. 126-138.
Matsuno Y, Hatcho N, Shindo S (2007b) Water transfer from agriculture to urban domestic users: a case study of the Tone river basin, Japan. Paddy
Water Environ 2007(5):239–246
Miller KA (1996) Water banking to manage supply variability. In: Hall DC (ed) Marginal cost rate design and wholesale water markets: advances in the
economics of environmental resources, vol 1. JAI Press Inc., Greenwich, pp 185–210
Scott CA, Flores-Loped F, Gastelum JR (2007) Appropriation of Rio San Juan water by Monterrey city, Mexico: implications for agriculture and basin
water sharing. Paddy Water Environ 2007(5):253–262
Mundlak, Yair, Estimation of Production and Behavioral Functions from a Combination of Cross-Section and Time-Series Data, in Christ, C. F., et al.,
Measurenmentin Economics, Stanford: Stanford University Press, 1963
Mundlak, Y., And I. Hoch, Consequence of Alternative Specifications in Estimation of Cobb-Douglas Production Functions, Econometrica, 33
(October, 1965), 814-828
Sameni Keivani. Farshad et al, (2013), The Estimation Of The Potential Capacity Of Zakah -A Case Study Of Iran, Journal of Basic and Applied
Scientific Research, J. Basic. Appl. Sci. Res., 3(3)528-531, text road, ISSN 2090-4304
Sameni Keivani. Farshad et al, (2013), The Creation Of bankruptcy prediction model with using Ohlson and Shirata models, Journal of Basic and
Applied Scientific Research, J. Basic. Appl. Sci. Res., 3(1)89-93, text road, ISSN 2090-4304
Sameni Keivani. Farshad et al, (2013), The Estimation of the Underdevelopment Degree of Different Regions- A Case Study of the Cities of Guilan
Province in Iran, World Applied Sciences Journal, 22 (10): 1395-1400, ISSN 1818-4952
Sameni Keivani. Farshad et al, (2013), The Historical Lack of Capital Accumulation in Iran's Agricultural Part, 11(5) IOSR Journals of Business and
Management (IOSR-JBM) e-ISSN: 2278-487X, p-ISSN: 2319-7668. Volume 10, Issue 4 (May. – Jun.), PP 88-90
Sameni Keivani. Farshad et al, (2013), Advantages and Barriers of E-Banking in Iran, Nature and Science Journal, 11(5)
Jalali, L. and Sameni Keivani. Farshad, an Investigation of Historical Geography, (2013), 11(5) IOSR Journals of Humanities a nd Social Science
(IOSR-JHSS) e-ISSN: 2279-0837, p-ISSN: 2279-0845. Volume 17, Issue 2 (Nov. – Dec.), PP 26-30
Sameni Keivani. Farshad et al, (2013), An Investigation of the Internet Effects on Business, IOSR Journals of Business and Management (IOSR-JBM),
e-ISSN: 2278-487X, p-ISSN: 2319-7668. Volume 13, Issue 6 (Sep. - Oct. 2013), PP 96-99
Sameni Keivani. Farshad et al, (2013), The Relationship between the Government Expenditures and Revenues in the Long Run, a Ca se Study of Iran,
IOSR Journals of Business and Management (IOSR-JBM) e-ISSN: 2278-487X, p-ISSN: 2319-7668. Volume 14, Issue 6 (Nov. - Dec.), PP 83-87
Sameni Keivani. Farshad et al, (2013), Strategic management; concepts, benefits and process, IOSR Journals of Business and Management (IOSRJBM) e-ISSN: 2278-487X, p-ISSN: 2319-7668, Volume 13, Issue 3 (Sep. - Oct.), PP 61-64
Sameni Keivani. Farshad et al, (2013), The role of Knowledge and confidence in reducing cost of electronic banking customers - a case study of Iran,
The 5th International Conference on Financial Criminology (ICFC), Global Trends in Financial Crimes in the New Economies,
Sameni Keivani, F., (2011), Synchronization of Economic Growth and Income Distribution, International Conference on Sociality and Economics
Development. IPEDR, vol. 10, pp. 7-11.
Sameni Keivani. Farshad et al, (2011), Conceptual Approach to E-government, Targets and Barriers Facing its, International Conference on
Construction and Project Management (ICCPM), September, 16-18, Singapore.
Sameni Keivani. Farshad et al, (2011), Conceptual Evaluation E-commerce, Objectives and the Necessary Infrastructure, International Conference on
Construction and Project Management (ICCPM), September, 16-18, Singapore
Sameni Keivani. Farshad et al, (2012), A General View on the E-banking, International Conference on Adoption Certificate profile and ISI,
International Economic Development and Research Center (IEDRC), Singapore, July 23-24
Sameni Keivani. Farshad et al, (2014), The Description of Zakah and Its Applying and Computing Models, Journal of Applied Env ironment and
Biological Sciences, text road, ISSN 2090-4274, J. Appl. Environ. Biol. Sci., 4(2)241-244
Sameni Keivani. Farshad et al, (2014), the Comparative Evaluation of the Underdevelopment Degree- A Case Study of The Villages of Roudsar City,
Journal of Applied Environment and Biological Sciences, text road, ISSN 2090-4274, J. Appl. Environ. Biol. Sci., 4(2)252-258
Sameni Keivani. Farshad et al, (2014), The Evaluation of the Impact of the Government Revenues on the Government Current Expe nditures A Case
Study of Iran, Journal of Applied Environment and Biological Sciences, text road, ISSN 2090-4274, J. Appl. Environ. Biol. Sci., 4(2)259-263
www.cbi.ir

