Fabrication of High Frequency (25
advertisement
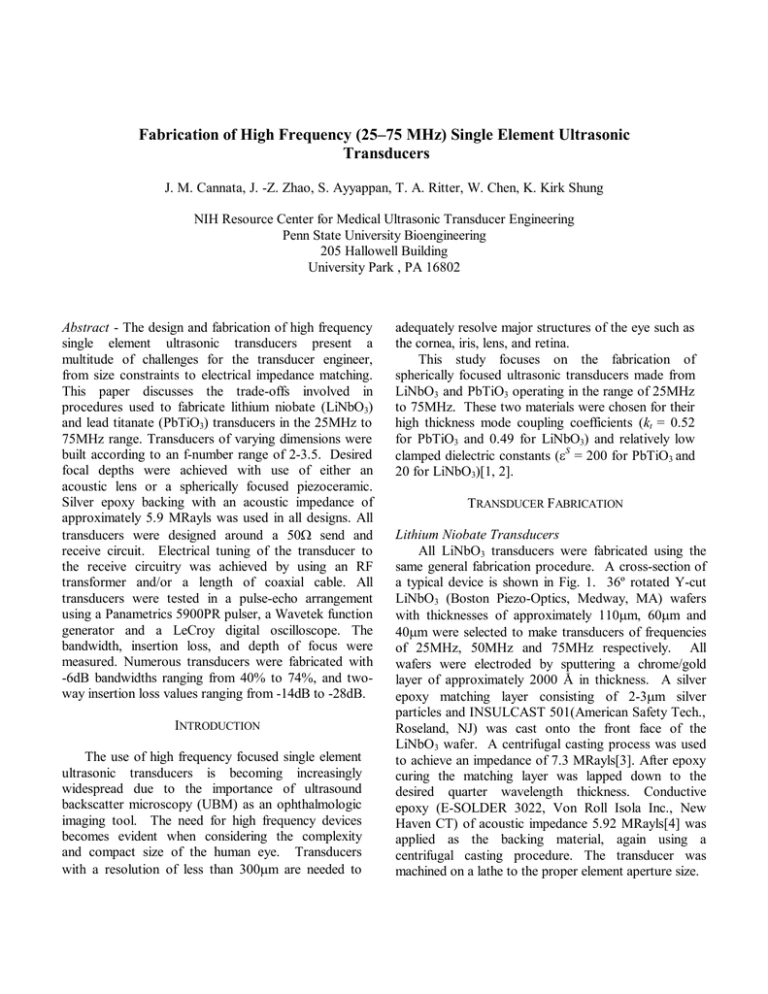
Fabrication of High Frequency (25–75 MHz) Single Element Ultrasonic Transducers J. M. Cannata, J. -Z. Zhao, S. Ayyappan, T. A. Ritter, W. Chen, K. Kirk Shung NIH Resource Center for Medical Ultrasonic Transducer Engineering Penn State University Bioengineering 205 Hallowell Building University Park , PA 16802 Abstract - The design and fabrication of high frequency single element ultrasonic transducers present a multitude of challenges for the transducer engineer, from size constraints to electrical impedance matching. This paper discusses the trade-offs involved in procedures used to fabricate lithium niobate (LiNbO3) and lead titanate (PbTiO3) transducers in the 25MHz to 75MHz range. Transducers of varying dimensions were built according to an f-number range of 2-3.5. Desired focal depths were achieved with use of either an acoustic lens or a spherically focused piezoceramic. Silver epoxy backing with an acoustic impedance of approximately 5.9 MRayls was used in all designs. All transducers were designed around a 50Ω send and receive circuit. Electrical tuning of the transducer to the receive circuitry was achieved by using an RF transformer and/or a length of coaxial cable. All transducers were tested in a pulse-echo arrangement using a Panametrics 5900PR pulser, a Wavetek function generator and a LeCroy digital oscilloscope. The bandwidth, insertion loss, and depth of focus were measured. Numerous transducers were fabricated with -6dB bandwidths ranging from 40% to 74%, and twoway insertion loss values ranging from -14dB to -28dB. INTRODUCTION The use of high frequency focused single element ultrasonic transducers is becoming increasingly widespread due to the importance of ultrasound backscatter microscopy (UBM) as an ophthalmologic imaging tool. The need for high frequency devices becomes evident when considering the complexity and compact size of the human eye. Transducers with a resolution of less than 300µm are needed to adequately resolve major structures of the eye such as the cornea, iris, lens, and retina. This study focuses on the fabrication of spherically focused ultrasonic transducers made from LiNbO3 and PbTiO3 operating in the range of 25MHz to 75MHz. These two materials were chosen for their high thickness mode coupling coefficients (kt = 0.52 for PbTiO3 and 0.49 for LiNbO3) and relatively low clamped dielectric constants (εS = 200 for PbTiO3 and 20 for LiNbO3)[1, 2]. TRANSDUCER FABRICATION Lithium Niobate Transducers All LiNbO3 transducers were fabricated using the same general fabrication procedure. A cross-section of a typical device is shown in Fig. 1. 36º rotated Y-cut LiNbO3 (Boston Piezo-Optics, Medway, MA) wafers with thicknesses of approximately 110µm, 60µm and 40µm were selected to make transducers of frequencies of 25MHz, 50MHz and 75MHz respectively. All wafers were electroded by sputtering a chrome/gold layer of approximately 2000 Å in thickness. A silver epoxy matching layer consisting of 2-3µm silver particles and INSULCAST 501(American Safety Tech., Roseland, NJ) was cast onto the front face of the LiNbO3 wafer. A centrifugal casting process was used to achieve an impedance of 7.3 MRayls[3]. After epoxy curing the matching layer was lapped down to the desired quarter wavelength thickness. Conductive epoxy (E-SOLDER 3022, Von Roll Isola Inc., New Haven CT) of acoustic impedance 5.92 MRayls[4] was applied as the backing material, again using a centrifugal casting procedure. The transducer was machined on a lathe to the proper element aperture size. SMA Connector Brass Ring Electrical Tuning Electrical Tuning Epoxy Backing Insulating Epoxy Insulating Epoxy Matching Layer LiNbO3 (Electroded) Lens Chrome/Gold Electrode Figure 1-Cross Section of LiNbO3 Transducers (Not to Scale). The positive lead wire was connected to the backing layer with additional conductive epoxy. A brass ring was placed concentric with the device, and an insulating epoxy was cast between the ring and the device. This enabled electrical connection of the brass ring to the transducer face using sputtered chrome/gold. Transducers were lensed with EPO-TEK 301 epoxy (Epoxy Tech., Billerica, MA) (density ρ= 1.15 g/cm3, longitudinal sound velocity ν= 2650 m/s)[4] using a ball bearing as a mold. The thickness of the lens at center was ¼λ. The governing equation used to determine the proper lens radius of curvature is as follows[5]: Cm Rc = Z f 1 − C l SMA Connector (1) where Rc is the radius of curvature, Zf is the focal distance, Cm is the sound velocity in water, and Cl is the longitudinal sound velocity in the lens material. Transducers were tuned with a RF transformer where indicated. The finished device was housed in a modified SMA connector. Lead Titanate Transducers The general procedure for the fabrication of PbTiO3 transducers followed that of Lockwood et al. [6]. Figure 2 shows a cross-section of the PbTiO3 transducers. Hot Isostatic Pressure (HIP) treated PbTiO3 (EC97 EDO Ceramics, Salt Lake City UT) wafers lapped down to approximately 100µm, 50µm and 30µm were used to make transducers of Brass Ring Epoxy Backing PbTiO3 (Electroded) Parylene Matching Layer Silver Epoxy Electrode Figure 2-Cross Section of PbTiO3 Transducers (Not to Scale). frequencies of 25MHz, 50MHz and 75MHz respectively. All wafers were electroded by sputtering a chrome/gold layer of approximately 2000Å in thickness. A conductive epoxy backing layer (E-SOLDER 3022) was cast and centrifuged onto the back of the PbTiO3 wafers. The transducer was turned down on a lathe to the proper element aperture size, and a positive lead wire was attached to the backing. A brass ring with back filled electrical insulating epoxy (INSULCAST 501) was cured around the transducers similar to the procedure used for the LiNbO3 transducers. The transducer was then focused by heat pressing a ball bearing of radius equal to that of the desired focal distance Zf [6]. The ground lead of the active element was connected to the brass ring by carefully painting on a layer of silver epoxy (ABLEBOND 16-1LV, Ablestik, Rancho Dominguez, CA) from the edge of the active element to the brass ring. Finally, a Parylene ¼λ matching layer was deposited across the face of the transducer (Specialty Coating systems, Indianapolis, IN; ρ= 1.18 g/cm3, ν= 2200 m/s)[7]. All transducers were tuned with either a 2:1, 4:1 or 9:1 transformer and series coaxial cable. Again, the finished device was housed in a modified SMA connector. TRANSDUCER CHARACTERIZATION Pulse-Echo Test Setup A Panametrics 5900PR was used as the pulser/receiver to measure center frequency, -6dB bandwidth and depth of focus. Transducers were pulsed into a degassed/de-ionized water bath. A Z-cut quartz crystal substrate was used as the pulse reflector. TABLE I MEASURED RESULTS Material CF(MHz) LiNbO3 22.4 21.4 24.7 44.5 PbTiO3 22.1* 45.1 62.0 74.0 * Uses an epoxy lens for focusing -6dB BW (%) IL (dB) Aperture (mm) F# Tuning 72 68 62 74 75 47 52 44 -19.2 -21.4 -14.4 -21.3 -28.2 -23.7 N/A N/A 10 10 8.5 3 8 3 4 3.8 3.1 3.7 4.5 2.9 4.5 2.4 2.0 2.1 None 2:1 Transformer None None 4:1 Transformer, Series Coax 9:1 Transformer, Series Coax 9:1 Transformer, Series Coax 9:1 Transformer, Series Coax The receive signal from the transducer was viewed by a LeCroy LC534 digital oscilloscope via from the RF output of the pulser. The length of cable between the pulser/receiver and the transducer was set at 30cm for all transducers, which is the same length of cable used for the UBM system at Penn State. Insertion Loss Test Setup A Wavetek 81 function generator operating in burst mode was used to measure the insertion loss of the transducers at the design center frequency. The peak amplitude of the burst waveform without the transducer was measured with the LC534 oscilloscope set at 50Ω coupling. The measurement of the transducer pulseecho amplitude was then measured with the oscilloscope set at 1MΩ coupling. The length of cable between the transducer and the function generator was 30cm for all transducers. The cable length between the function generator and the oscilloscope was 10cm, which makes it a negligible fraction of a wavelength at the frequencies of interest. The receive pressure/voltage lost due to absorption in the quartz crystal was compensated for with the following formula[5]: Z Q + ZW Pi = PR Z − Z W Q (2) Whereby Pi is the incident pressure of the pulse, PR is the reflected pressure, and ZQ and ZW are the acoustic impedance of the quartz and water respectively. Since voltage is analogous to pressure, we were able to calculate the incident voltage directly from equation 2. The signal loss due to attenuation in the water bath was also compensated for using an attenuation of 2.2x10⁻⁴ dB/mm-MHz2[5]. RESULTS Eight transducers were fabricated and tested, and the results of which are listed in Table 1. The range of insertion loss values varied from -14.4dB to -21.4dB for LiNbO3 and -23.8 to -28.2 for PbTiO3 transducers. Insertion loss values for transducers with center frequencies greater than 50MHz were not measured due to the frequency limit on the function generator. Figures 3 and 4 show pulse echo waveforms for a 22.4MHz LiNbO3 transducer and a 74MHz PbTiO3 transducer, respectively. Figure 5 shows images of a human eye produced by the UBM system at Penn State University using the two 45MHz devices fabricated for this study. It is easy to distinguish the cornea, iris, lens and ciliary muscle in both images. DISCUSSION AND CONCLUSION The two fabrication procedures described above were successful in producing quality transducers in the frequency range of interest. The loss of signal due to attenuation in the epoxy lens is not significant in reducing the insertion loss of LiNbO3 transducers. At frequencies higher than 75MHz, this attenuation in the lens may affect the overall performance of this design. At such high frequencies one might have to adopt the method used for the PbTiO3 transducers. The LiNbO3 transducers proved to be better matched to the 50Ω send and receive circuit than the PbTiO3 transducers. This is mainly due to the lower εS for LiNbO3. As a result, all PbTiO3 transducers required electrical tuning, whereas most of the LiNbO3 transducers did not. Generally, the electrical tuning used on the PbTiO3 transducers decreased the insertion loss but sacrificed bandwidth. 0.75 Received Voltage (V) Received Voltage (V) 2 1 0 -1 0.5 0.25 0 -0.25 -0.5 -2 -0.75 100 200 300 Time (ns) 400 500 0 0 Normalized Received Voltage (dB) Normalized Received Voltage (dB) 0 -20 -40 -60 -80 0 10 20 30 40 50 Frequency (MHz) Figure 3- Pulse echo waveform and envelope for the 22.4MHz LiNbO3 Transducer. b b d d c Figure 5- UBM images produced with the 45MHz LiNbO3 Transducer(left) and the 45MHz PbTiO3 Transducer(right). The cornea(a), iris(b), lens(c) and ciliary muscle(d) are visible in both images. 200 300 Time (ns) 400 500 0 -10 -20 -30 -40 -50 40 60 80 Frequency (MHz) 100 Figure 4- Pulse echo waveform and envelope for the 75MHz PbTiO3 Transducer. a a 100 c Overall, both materials and fabrication procedures are suitable for the production of focused single element ultrasonic transducers operating in the range of 25MHz to 75MHz. Future work will focus on the fabrication of transducers above 100MHz as well as the improvement of electrical tuning techniques. ACKNOWLEDGMENTS The authors would like to acknowledge Gene Gerber for his help with the transducer fabrication process, and Dr. Ronald H. Silverman for his help with the UBM system. Financial support was provided through NIH grant P41-RR11795. REFERENCES [1] M. J. Zipparo, K. K. Shung, and T. R. Shrout, “Piezoceramics for High-Frequency (20 to 100MHz) Single-Element Imaging Transducers,” IEEE Trans. Ultrason., Ferroelect., Freq. Contr., vol. 44, pp. 1038-1048, Sept. 1997. [2] The User’s Guide to Ultrasound and Optical Products, Valepy-Fisher Corporation, Hopkinton MA. 1999 [3] T. R. Ritter, “Medical Imaging Arrays for Frequencies above 25MHz,” presented at the IEEE International Ultrasonics Symposium, Lake Tahoe, NV, October 17-20, 1999. [4] H. Wang, T. R. Ritter, W. Cao, and K. K. Shung, “Passive Materials for High Frequency Ultrasonic Transducers,” Proceedings of the SPIE Medical Imaging, Ultrasonic Transducer Imaging, vol.3664, 1999, pp. 35-42. [5] K. K. Shung, M. B. Smith, and B Tsui, Principles of Medical Imaging, New York: Academic Press, 1992, ch. 2, pp. 78-161. [6] G. R. Lockwood, D. H. Turnbull, and F. S. Foster, “Fabrication of High Frequency Spherically Shaped Ceramic Transducers,” IEEE Trans. Ultrason., Ferroelect., Freq. Contr., vol. 41, pp. 231-235, Mar. 1994. [7] Homepage of Specialty Engineering Associates, http://www.ultrasonic.com.
