Return on Equity

Return on Equity
Fall 2011
This assignment is worth 40 points (4.0% of the course grade) and must be completed and turned in before 11:59 on Monday, October 17, 2011 .
Assignment Overview
This assignment will give you more experience on the use of:
1.
Lists and iteration through list
2.
File I/O
3.
Functions
4.
Graphing using Matplotlib
Background
The financial measure Return on equity (ROE) gauges the efficiency of a company.
Essentially, it measures a firm's efficiency at generating profits from every unit of shareholder equity.
The larger this number is, the better return each share holder receives. The American investor Warren Edward Buffett (1930 - ) believes that knowing the ROE is the most important factor in successful stock investment selection.
However, high ROE doesn't always guaranty large profits. For example, consulting industry firms needs requires less shareholder investment and thus always has high
ROE while a petroleum refinery, with substantial overhead, often has lower ROE.
The investment preference of Mr. Warren Buffett is that he never invests in companies which have an ROE lower than 15%. He holds stock of the Coca-Cola Company
(ROE 30%) and American Express (ROE 37%) .
Now, this famous investor asks for your help. He is considering investing in
Starbucks, an international coffee and coffeehouse chain based in Seattle. Several annual reports are available in: http://investor.starbucks.com/phoenix.zhtml?c=99518&p=irol-reportsannual
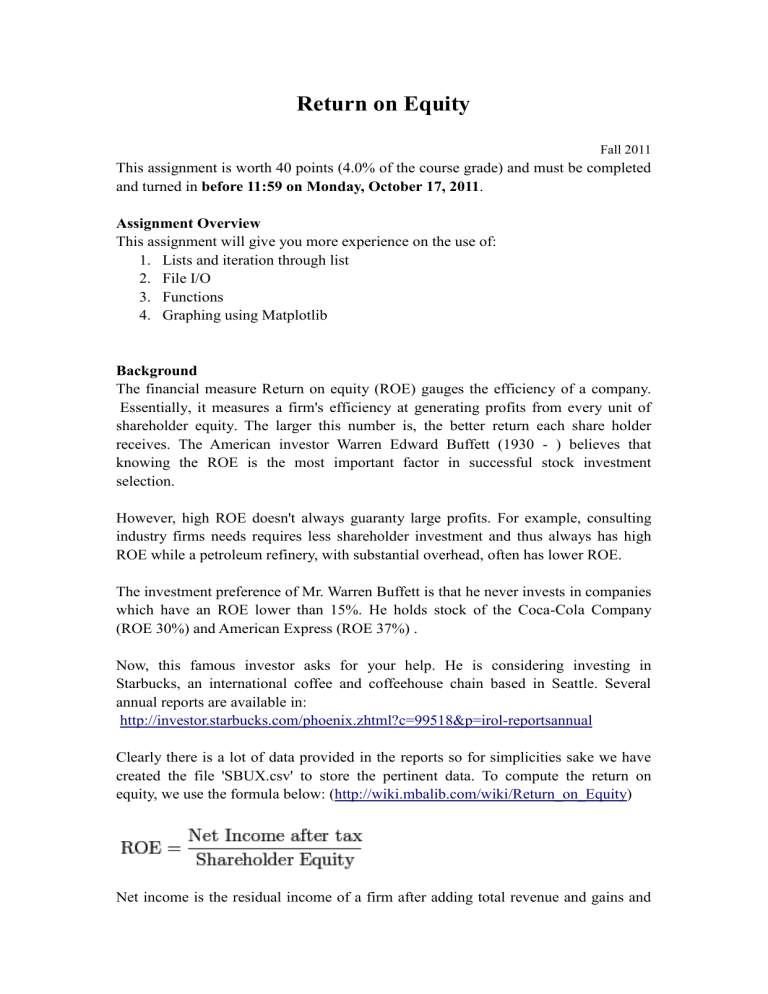
Clearly there is a lot of data provided in the reports so for simplicities sake we have created the file 'SBUX.csv' to store the pertinent data. To compute the return on equity, we use the formula below: ( http://wiki.mbalib.com/wiki/Return_on_Equity )
Net income is the residual income of a firm after adding total revenue and gains and
subtracting all expenses and losses for the reporting period. This information is stored on the 5 th row of 'SBUX.csv'.
Shareholders' equity represents the remaining interest in assets of a company, spread among individual shareholders of common or preferred stock. This information is stored on the 8 th row of 'SBUX.csv'.
Another famous formula to compute the ROE is the DuPont formula. It breaks down
ROE into three important components: net margin, asset turnover and financial leverage.
Sales is the total receipts of a firm from the sale of any given quantity of output. This information is stored on the 3 th row of 'SBUX.csv'.
Total assets are economic resources. This information is stored on the 7th row of
'SBUX.csv'.
To compute the Average stockholder equity, we take the average number of stockholder equity of this year and the year before this year. For example, the equity of 2003 is $2071.11, the equity of 2004 is $3386.54, so the average equity of 2004 is
($2071.11 + $3386.54) / 2 = $2728.825. If we haven’t equity information of 2002, we use the 2003 equity to be the average equity of 2003.
More information can be found here: http://www.investopedia.com/terms/r/returnonequity.asp
http://finance.yahoo.com/q/is?s=SBUX&annual http://www.ticker.com/quote/?symbol=sbux
Project Specification
1.
Prompt the user for the name of the file containing the data
2.
Extract the required fields
3.
Compute the average stockholder equity from year 2003 to 2009
4.
Compute the return on equity with the two methods above from year 2003 to
2009
5.
Use lists to store you computed ROE. Print the lists.
6.
Extra Credit (5 pts): Use Matplotlib to graph the information you extract and the ROE you have computed
Figure 1: With net income, stockholder equity and ROE in the same figure.
Figure 2: With sales, total assets, net margin, asset turnover, financial leverage and ROE in the same figure.
Deliverable
Turn in a single file named proj05.py which does all of the above.
List of Files to Download
SBUX.csv
Notes and Hints
Please implement this task step by step. For example, first read the data from file to your lists, and print the list to see the contents, make sure everything is fine then move to next step. Compute the ROE, test to ensure that the result is reasonable, then you can start to plot the figures.
The data in each row of the file can be split by comma. The code would look like this: fd = open(filename) for line in fd: lineList = line.split(',') for number in lineList:
#do something to the number
For basic help on matplotlib, refer to your textbook and to: http://matplotlib.sourceforge.net/examples/pylab_examples/index.html
For information on how to use matplotlib to plot multiple data on the same plot with multiple y-axes, see : http://matplotlib.sourceforge.net/faq/howto_faq.html#multipley-axis-scales


