Lecture 5 Data Visualization
advertisement
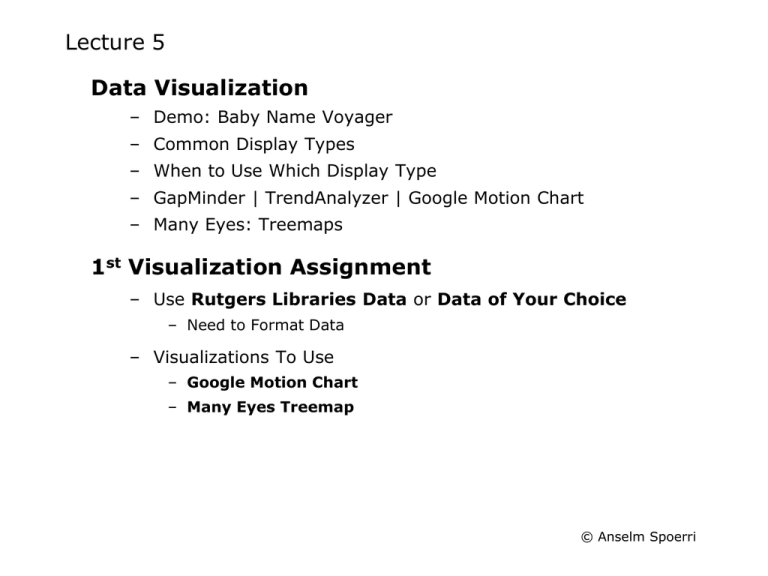
Lecture 5 Data Visualization – Demo: Baby Name Voyager – Common Display Types – When to Use Which Display Type – GapMinder | TrendAnalyzer | Google Motion Chart – Many Eyes: Treemaps 1st Visualization Assignment – Use Rutgers Libraries Data or Data of Your Choice – Need to Format Data – Visualizations To Use – Google Motion Chart – Many Eyes Treemap © Anselm Spoerri Demo – Baby Names Voyager http://www.babynamewizard.com/voyager © Anselm Spoerri Data Visualization – Common Display Types Common Display Types – Bar Charts – Line Charts – Pie Charts – Bubble Charts – Stacked Charts – Scatterplots © Anselm Spoerri Gapminder – Motion Charts http://www.gapminder.org/ © Anselm Spoerri Many Eyes – Data & Information Visualization http://manyeyes.alphaworks.ibm.com/manyeyes/ © Anselm Spoerri Google Motion Chart Motion Chart | Format Your Data Example : what is needed for effective Motion Chart 1st Visualization – Google Motion Chart Requirements – Time data dimension – At least three independent data dimensions that can be displayed on the x and y axes of the scatterplot – At least one categorical data dimension – At least one relevant data dimension than be used for size coding – In Total, at least six data variables © Anselm Spoerri Scatterplot – Visual Correlation Patterns © Anselm Spoerri Scatterplot – Visual Correlation Patterns © Anselm Spoerri Scatterplot – Visual Correlation Patterns © Anselm Spoerri Treemap How to Create Example : what is needed for multiple levels 1st Visualization – Treemap Requirements – At least three hierarchical levels – Numerical variable of interest is used for size coding – Ideally provide a further numerical data variable for color coding – Tip: temporal data and want "time" (such as "year" or "month") to be hierarchical variable then time period values need to be "string". © Anselm Spoerri


