section 8-6
advertisement

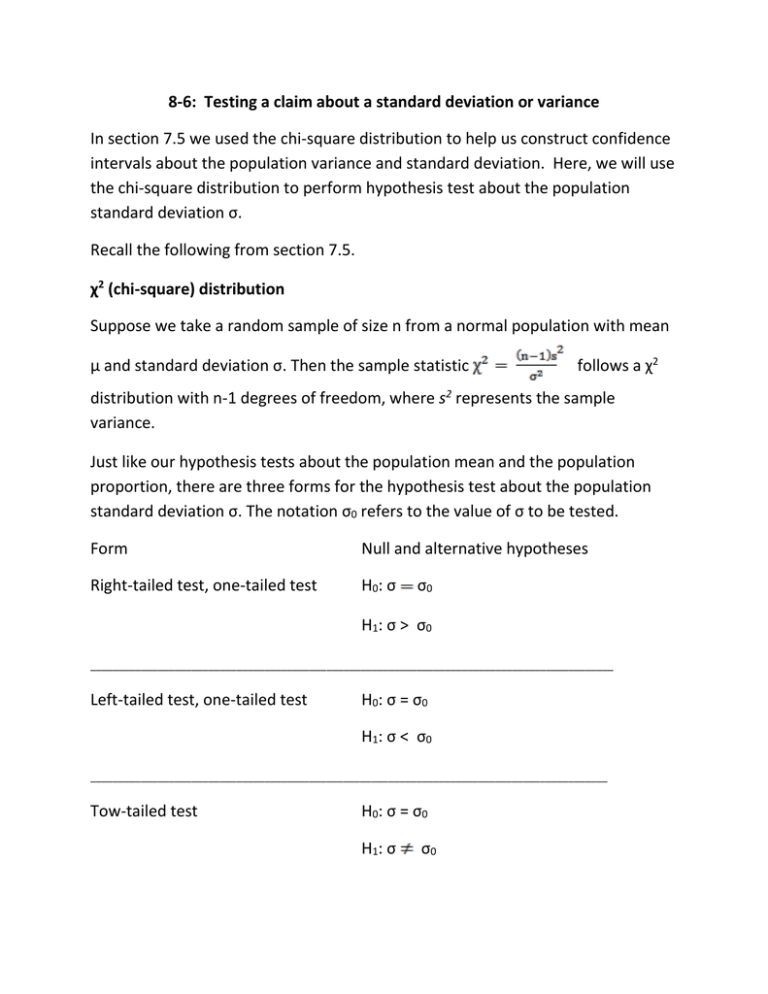
8-6: Testing a claim about a standard deviation or variance In section 7.5 we used the chi-square distribution to help us construct confidence intervals about the population variance and standard deviation. Here, we will use the chi-square distribution to perform hypothesis test about the population standard deviation σ. Recall the following from section 7.5. χ2 (chi-square) distribution Suppose we take a random sample of size n from a normal population with mean µ and standard deviation σ. Then the sample statistic follows a χ2 distribution with n-1 degrees of freedom, where s2 represents the sample variance. Just like our hypothesis tests about the population mean and the population proportion, there are three forms for the hypothesis test about the population standard deviation σ. The notation σ0 refers to the value of σ to be tested. Form Null and alternative hypotheses Right-tailed test, one-tailed test H0: σ σ0 H1: σ > σ0 _____________________________________________________________________________________________ Left-tailed test, one-tailed test H0: σ = σ0 H1: σ < σ0 ____________________________________________________________________________________________ Tow-tailed test H0: σ = σ0 H1: σ σ0 Under the assumption that H0 is true, the chi-square statistic takes the following form: For the hypothesis test about σ, the test statistic is . This test statistic takes a moderate value when the value of s2 is moderate assuming H0 is true, and the test statistic takes an extreme value when the value of s2 is extreme assuming H0 is true. This leads us to the following. When the observed value of is unusual or extreme on the assumption that H0 is true, we should reject H0. Otherwise, there is insufficient evidence against H0 and we should not reject H0. Critical values and rejection rules for the chi-square test for σ Form Null and alternative hypotheses __________________________________________________________ Right-tailed test, one-tailed test H0: σ σ0 H1: σ > σ0 Critical value: Reject H0 if > ________________________________________________________________ left-tailed test, one-tailed test H0: σ σ0 H1: σ < σ0 Critical value: Reject H0 if < ____________________________________________________________ two-tailed test H0: σ σ0 H1: σ σ0 Critical values: Reject H0 if > < ___________________________________________________________ Guideline for chi-square test for σ using the traditional method: This hypothesis test is valid only if we have a random sample from a normal population. Step1: State the hypotheses. Use one the three forms. Clearly define σ. Step 2: Find the critical value or values and state the rejection rule. Step 3: Find test statistic Step 4: State the conclusion and the interpretation. If the test statistic falls in the critical region, then reject H0. Otherwise do not reject H0. Ex 1) Suppose a children’s shoe manufacturer is interested in estimating the variability of fourth-graders’ feet. A random sample of 20 fourth-graders’ feet yielded the following foot lengths, in centimeters. The normality of the data was verified before. We are interested in whether the population standard deviation of foot lengths is less than 1 centimeter. 22.4 23.4 22.5 23.2 23.1 23.7 24.1 21.0 21.6 20.9 25.5 22.8 24.1 25.0 24.0 21.7 22.0 22.7 24.7 23.5 a. State the hypothesis. b. Find the critical value for level of significance 0.05. c. The sample variance is 1.638. Calculate the test statistic. d. Test your claim. e. Interpret your conclusion.


