Table 4. Symbols used in statistics
advertisement
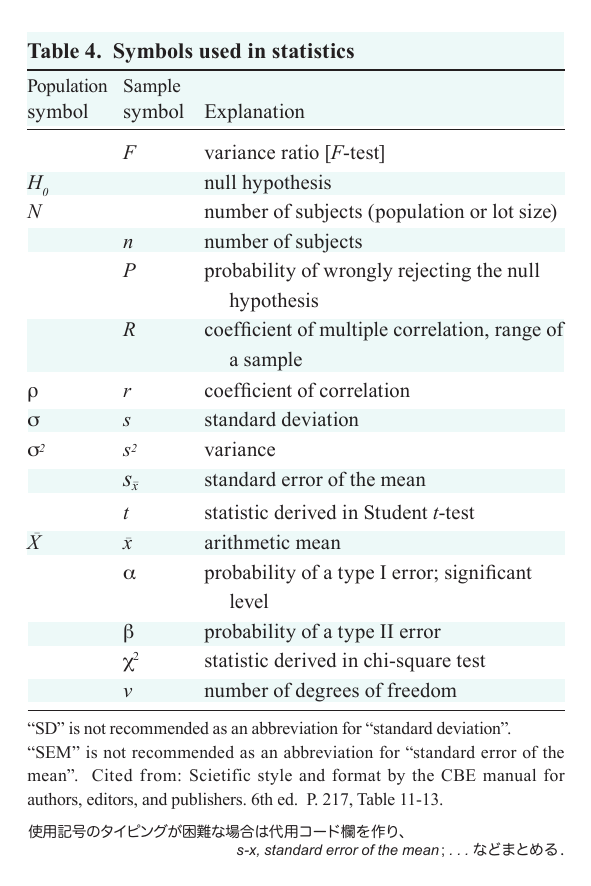
Table 4. Symbols used in statistics PopulationSample symbol symbolExplanation F H0 N n P r s s2 variance ratio [F-test] null hypothesis number of subjects (population or lot size) number of subjects probability of wrongly rejecting the null hypothesis R coefficient of multiple correlation, range of a sample r coefficient of correlation s standard deviation s2variance sx_ standard error of the mean t _ _ Xx a b c2 v statistic derived in Student t-test arithmetic mean probability of a type I error; significant level probability of a type II error statistic derived in chi-square test number of degrees of freedom “SD” is not recommended as an abbreviation for “standard deviation”. “SEM” is not recommended as an abbreviation for “standard error of the mean”. Cited from: Scietific style and format by the CBE manual for authors, editors, and publishers. 6th ed. P. 217, Table 11-13. 使用記号のタイピングが困難な場合は代用コード欄を作り、 s-x, standard error of the mean ; . . . などまとめる .


