Note Cards for Portfolio
advertisement
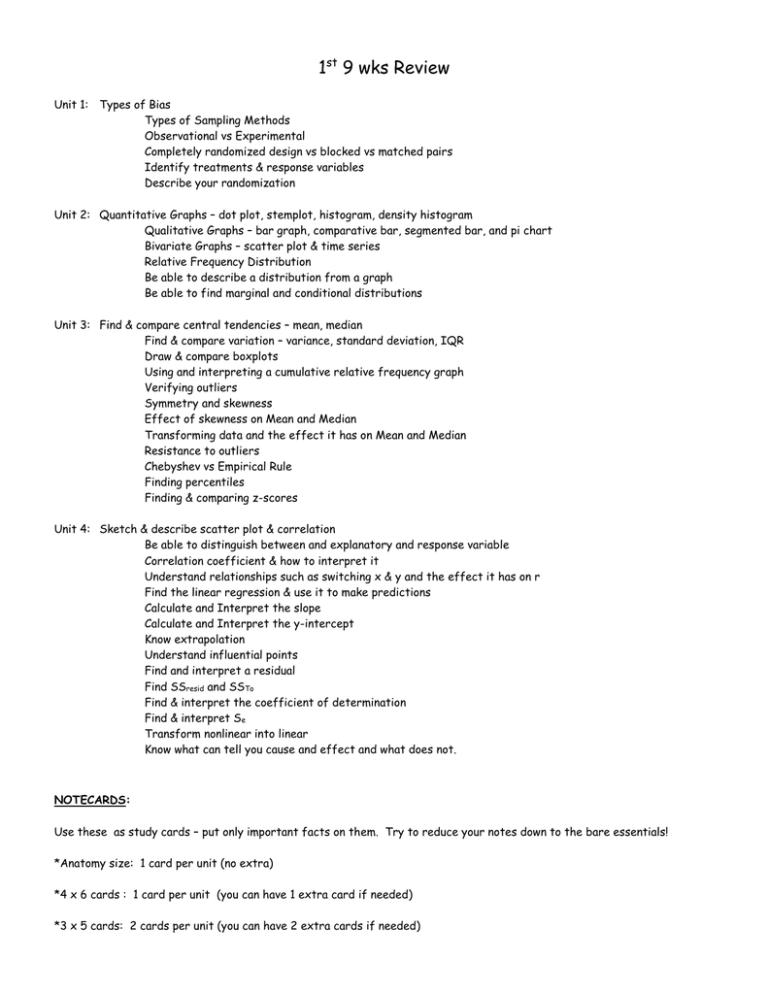
1st 9 wks Review Unit 1: Types of Bias Types of Sampling Methods Observational vs Experimental Completely randomized design vs blocked vs matched pairs Identify treatments & response variables Describe your randomization Unit 2: Quantitative Graphs – dot plot, stemplot, histogram, density histogram Qualitative Graphs – bar graph, comparative bar, segmented bar, and pi chart Bivariate Graphs – scatter plot & time series Relative Frequency Distribution Be able to describe a distribution from a graph Be able to find marginal and conditional distributions Unit 3: Find & compare central tendencies – mean, median Find & compare variation – variance, standard deviation, IQR Draw & compare boxplots Using and interpreting a cumulative relative frequency graph Verifying outliers Symmetry and skewness Effect of skewness on Mean and Median Transforming data and the effect it has on Mean and Median Resistance to outliers Chebyshev vs Empirical Rule Finding percentiles Finding & comparing z-scores Unit 4: Sketch & describe scatter plot & correlation Be able to distinguish between and explanatory and response variable Correlation coefficient & how to interpret it Understand relationships such as switching x & y and the effect it has on r Find the linear regression & use it to make predictions Calculate and Interpret the slope Calculate and Interpret the y-intercept Know extrapolation Understand influential points Find and interpret a residual Find SSresid and SSTo Find & interpret the coefficient of determination Find & interpret Se Transform nonlinear into linear Know what can tell you cause and effect and what does not. NOTECARDS: Use these as study cards – put only important facts on them. Try to reduce your notes down to the bare essentials! *Anatomy size: 1 card per unit (no extra) *4 x 6 cards : 1 card per unit (you can have 1 extra card if needed) *3 x 5 cards: 2 cards per unit (you can have 2 extra cards if needed)
