Solutions Chapter 09
advertisement

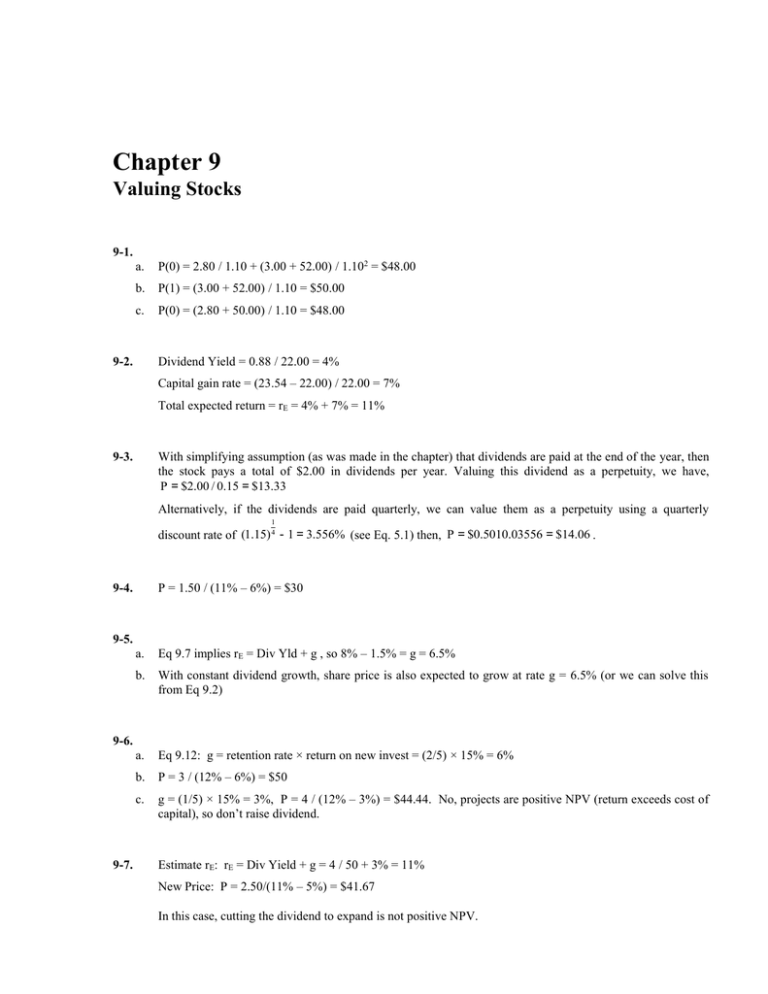
Chapter 9 Valuing Stocks 9-1. a. P(0) = 2.80 / 1.10 + (3.00 + 52.00) / 1.102 = $48.00 b. P(1) = (3.00 + 52.00) / 1.10 = $50.00 c. P(0) = (2.80 + 50.00) / 1.10 = $48.00 9-2. Dividend Yield = 0.88 / 22.00 = 4% Capital gain rate = (23.54 – 22.00) / 22.00 = 7% Total expected return = rE = 4% + 7% = 11% 9-3. With simplifying assumption (as was made in the chapter) that dividends are paid at the end of the year, then the stock pays a total of $2.00 in dividends per year. Valuing this dividend as a perpetuity, we have, P = $2.00 / 0.15 = $13.33 Alternatively, if the dividends are paid quarterly, we can value them as a perpetuity using a quarterly 1 discount rate of (1.15) 4 - 1 = 3.556% (see Eq. 5.1) then, P = $0.5010.03556 = $14.06 . P = 1.50 / (11% – 6%) = $30 9-4. 9-5. a. Eq 9.7 implies rE = Div Yld + g , so 8% – 1.5% = g = 6.5% b. With constant dividend growth, share price is also expected to grow at rate g = 6.5% (or we can solve this from Eq 9.2) a. Eq 9.12: g = retention rate × return on new invest = (2/5) × 15% = 6% b. P = 3 / (12% – 6%) = $50 c. g = (1/5) × 15% = 3%, P = 4 / (12% – 3%) = $44.44. No, projects are positive NPV (return exceeds cost of capital), so don’t raise dividend. 9-6. 9-7. Estimate rE: rE = Div Yield + g = 4 / 50 + 3% = 11% New Price: P = 2.50/(11% – 5%) = $41.67 In this case, cutting the dividend to expand is not positive NPV. 84 9-8. Berk/DeMarzo • Corporate Finance Value if the first 5 dividend payments PV15 1.12 5 $3.24 1 0.08 0.12 1.08 0.65 Value on date 5 of the rest of the dividend payments 0.65 1.12 1.02 4 PV5 0.08 0.02 17.39 Discounting this value to the present gives 17.39 PV0 1.08 5 $11.83 So the value of Gillette is: P PV15 PV0 3.24 11.83 $15.07 9-9. PV of the first 5 dividends PVfirst 5 0.96 1.11 5 1.11 5.14217 1.085 1 0.085 0.11 PV of the remaining dividends in year 5 0.96 1.11 1.052 5 PVremaining in year 5 0.085 0.052 51.5689 Discounting back to the present PVremaining 51.5689 1.085 5 34.2957 Thus the price of Colgate is P PVfirst 5 PVremaining 39.4378 9-10. n-year, cons tan t growth annuity P0 Div1 PV of ter min al value n n 1 g1 1 g1 Div1 1 r 1 r r g2 1 r g1 Div1 r g1 cons tan t growth perpetuity 1 g1 Div1 Div1 1 r r g 2 r g1 n present value of difference of perpetuities in year n Chapter 9 Valuing Stocks See the spreadsheet for Halliford’s dividend forecast: 9-11. Year 0 Earnings 1 EPS Growth Rate (vs. prior yr) 2 EPS Dividends 3 Retention Ratio 4 Dividend Payout Ratio 5 Div (2 × 4) 1 2 3 4 5 6 25% 25% 12.5% 12.5% 5% $3.00 $3.75 $4.69 $5.27 $5.93 $6.23 100% 100% 50% 50% 20% 20% 0% 0% 50% 50% 80% 80% — — $2.34 $2.64 $4.75 $4.98 From year 5 on, dividends grow at constant rate of 5%. Therefore, P(4) = 4.75/(10% – 5%) =$95. Then: P(0) = 2.34 / 1.103 + (2.64 + 95) / 1.104 = $68.45 9-12. Total payout next year = 5 billion × 1.08 = $5.4 billion Equity Value = 5.4 / (12% – 8%) = $135 billion Share price = 135 / 6 = $22.50 9-13. a. Earnings growth = EPS growth = dividend growth = 4%. Thus, P = 3 / (10% – 4%) = $50. b. Using the total payout model, P = 3/(10% – 4%) = $50 c. g = rE – Div Yield = 10% – 1/50 = 8% 9-14. a. V(4) = 82 / (14% – 4%) = $820 V(0) = 53 / 1.14 + 68/1.142 + 78 / 1.143 + (75 + 820) / 1.144 =$681 b. 9-15. a. P = (681 + 0 – 300)/40 = $9.53 V(3) = 33.3 / (10% – 5%) = 666 V(0) = 25.3 / 1.10 + 24.6 / 1.102 + (30.8 + 666) / 1.103 = 567 P(0) = (567 + 40 – 120) / 60 = $8.11 85 86 Berk/DeMarzo • Corporate Finance b. Free cash flows change as follows: Year Earnings Forecast ($000s) 1 Sales 2 Cost of Goods Sold 3 Gross Profit 4 Selling, General & Admin. 6 Depreciation 7 EBIT 8 Income tax at 40% 9 Unlevered Net Income Free Cash Flow ($000s) 10 Plus: Depreciation 11 Less: Capital Expenditures 12 Less: Increases in NWC 13 Free Cash Flow 0 433.00 1 8% 468.00 (327.60) 140.40 (93.60) (7.00) 39.80 (15.92) 23.88 2 10% 516.00 (361.20) 154.80 (103.20) (7.50) 44.10 (17.64) 26.46 3 6% 546.96 (382.87) 164.09 (109.39) (9.00) 45.70 (18.28) 27.42 4 5% 574.31 (402.02) 172.29 (114.86) (9.45) 47.98 (19.19) 28.79 5 5% 603.02 (422.12) 180.91 (120.60) (9.92) 50.38 (20.15) 30.23 7.00 (7.70) (6.30) 16.88 7.50 (10.00) (8.64) 15.32 9.00 (9.90) (5.57) 20.94 9.45 (10.40) (4.92) 22.92 9.92 (10.91) (5.17) 24.07 1 8% 468.00 (313.56) 154.44 (74.88) (7.00) 72.56 (29.02) 43.54 2 10% 516.00 (345.72) 170.28 (82.56) (7.50) 80.22 (32.09) 48.13 3 6% 546.96 (366.46) 180.50 (87.51) (9.00) 83.98 (33.59) 50.39 4 5% 574.31 (384.79) 189.52 (91.89) (9.45) 88.18 (35.27) 52.91 5 5% 603.02 (404.03) 199.00 (96.48) (9.92) 92.59 (37.04) 55.55 7.00 (7.70) (6.30) 36.54 7.50 (10.00) (8.64) 36.99 9.00 (9.90) (5.57) 43.92 9.45 (10.40) (4.92) 47.04 9.92 (10.91) (5.17) 49.39 Hence V(3) = 458, and V(0) = 388. Thus, P(0) = $5.13 c. New FCF: Year Earnings Forecast ($000s) 1 Sales 2 Cost of Goods Sold 3 Gross Profit 4 Selling, General & Admin. 6 Depreciation 7 EBIT 8 Income tax at 40% 9 Unlevered Net Income Free Cash Flow ($000s) 10 Plus: Depreciation 11 Less: Capital Expenditures 12 Less: Increases in NWC 13 Free Cash Flow 0 433.00 Now V(3) = 941, V(0) = 804, P(0) = $12.07 Chapter 9 d. Valuing Stocks 87 Inc. in NWC in yr1 = 12% Sales(1) – 18% Sales(0) Inc in NWC in later years = 12% × change in sales New FCF: Year Earnings Forecast ($000s) 1 Sales 2 Cost of Goods Sold 3 Gross Profit 4 Selling, General & Admin. 6 Depreciation 7 EBIT 8 Income tax at 40% 9 Unlevered Net Income Free Cash Flow ($000s) 10 Plus: Depreciation 11 Less: Capital Expenditures 12 Less: Increases in NWC 13 Free Cash Flow 0 433.00 1 8% 468.00 (313.56) 154.44 (93.60) (7.00) 53.84 (21.54) 32.30 2 10% 516.00 (345.72) 170.28 (103.20) (7.50) 59.58 (23.83) 35.75 3 6% 546.96 (366.46) 180.50 (109.39) (9.00) 62.10 (24.84) 37.26 4 5% 574.31 (384.79) 189.52 (114.86) (9.45) 65.21 (26.08) 39.13 5 5% 603.02 (404.03) 199.00 (120.60) (9.92) 68.47 (27.39) 41.08 7.00 (7.70) 21.78 53.38 7.50 (10.00) (5.76) 27.49 9.00 (9.90) (3.72) 32.65 9.45 (10.40) (3.28) 34.90 9.92 (10.91) (3.45) 36.64 Now V(3) = 698, V(0) = 620, P(0) = $9.00 9-16. a. $25.38 – $27.41 b. $23.76 – $29.02 c. $28.09 – $23.60 d. By changing parameters you get prices from 20.57 to 32.19. 9-17. a. Share price = Average P/E × KCP EPS = 15.01 × $1.65 = $24.77 b. Minimum = 8.66 × $1.65 = $14.29, Maximum = 22.62 × $1.65 = $37.32 c. 2.84 × $12.05 = $34.22 d. 1.12 × $12.05 = $13.50, 8.11 × $12.05 = $97.73 9-18. a. Estimated enterprise value for KCP = Average EV/Sales × KCP Sales = 1.06 × $518 million = $549 million. Equity Value = EV – Debt + Cash = $549 – 3 + 100 = $646 million. Share price = Equity Value / Shares = $646/ 21 = $30.77 b. $16.21 – $58.64 c. Est. enterprise value for KCP = Average EV/EBITDA × KCP EBITDA = 8.49 × $55.6 million = $472 million. Share Price = ($472 – 3 + 100)/21 = $27.10 d. $22.25 – $33.08 Berk/DeMarzo • Corporate Finance 88 9-19. a. Using EV/EBITDA: EV = 55.6 × 9.73 = 541 million, P = (541 + 100 – 3) / 21 = $30.38 Using P/E: P = 1.65 × 18.4 = $30.36 Thus, KCP appears to be trading at a “discount” relative to Fossil. b. Using EV/EBITDA: EV = 55.6 × 7.19 = 400 million, P = (400 + 100 – 3) / 21 = $23.67 Using P/E: P = 1.65 × 17.2 = $28.38 Thus, KCP appears to be trading at a “premium” relative to Tommy Hilfiger using EV/EBITDA, but at a slight discount using P/E. 9-20. All the multiples show a great deal of variation, suggesting that profitability and growth varies widely across firms. This makes the use of multiples problematic. In particular, for several firms, earnings and EBIT are negative, and for Nissan, book value is negative, making these ratios meaningless. In this case, EV/Sales is probably the most useful multiple. The one big outlier is GM, but this is probably because its EV is over-estimated, since the debt component is based on book value of debt, and the market value of GM’s debt has dropped substantially recently (GM’s debt was downgraded to junk in 2005). 9-21. a. b. 9-22. a. b. 9-23. a. P = 1.24 / (8% – 7%) = $124 Based on the market price, our growth forecast is probably too high. Growth rate consistent with market price is g = rE – div yield = 8% – 1.24 / 43= 5.12%, which is more reasonable. PV(change in FCF) = –180 / 1.13 – 60 / 1.132 = -206 Change in V = –206, so if debt value does not change, P drops by 206 / 35 =$5.89 per share. If this is public information, in an efficient market share price will drop immediately to reflect the news, and no trading profit is possible. Market seems to assess a somewhat greater than 50% chance of success b. Yes, if they have better information than other investors c. Market may be illiquid – no one wants to trade if they know Kliner has better info. Kliner’s trades will move prices significantly, limiting profits.


