The Normal distribution learner activity (DOC, 1MB)
advertisement
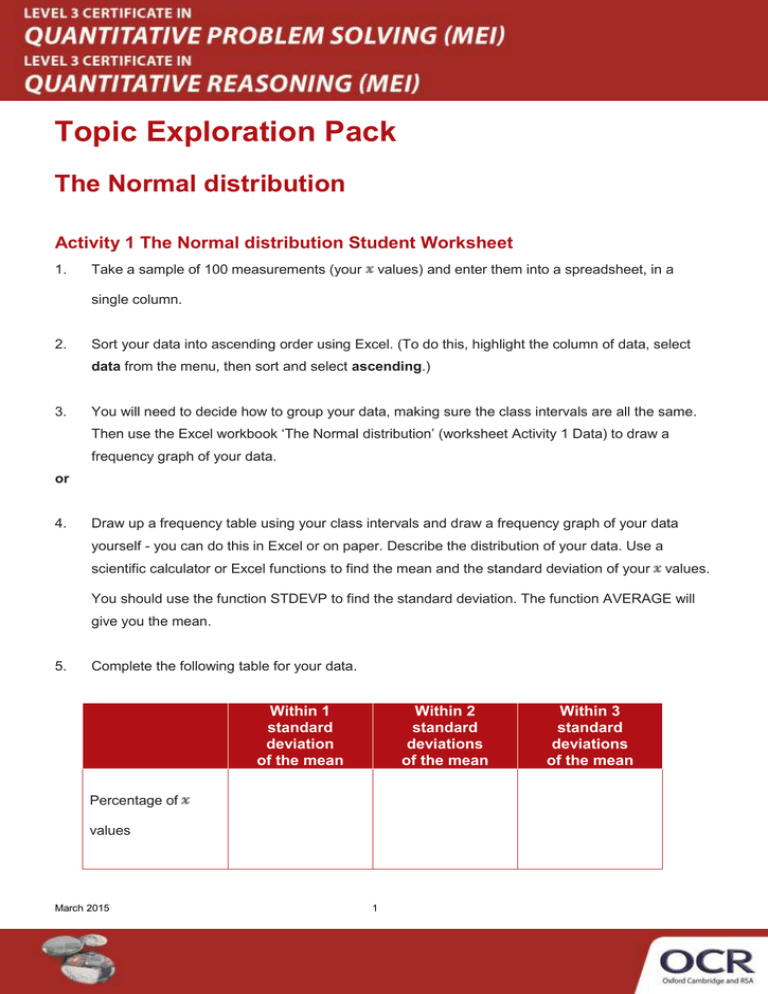
Topic Exploration Pack The Normal distribution Activity 1 The Normal distribution Student Worksheet 1. Take a sample of 100 measurements (your values) and enter them into a spreadsheet, in a single column. 2. Sort your data into ascending order using Excel. (To do this, highlight the column of data, select data from the menu, then sort and select ascending.) 3. You will need to decide how to group your data, making sure the class intervals are all the same. Then use the Excel workbook ‘The Normal distribution’ (worksheet Activity 1 Data) to draw a frequency graph of your data. or 4. Draw up a frequency table using your class intervals and draw a frequency graph of your data yourself - you can do this in Excel or on paper. Describe the distribution of your data. Use a scientific calculator or Excel functions to find the mean and the standard deviation of your values. You should use the function STDEVP to find the standard deviation. The function AVERAGE will give you the mean. 5. Complete the following table for your data. Within 1 standard deviation of the mean Within 2 standard deviations of the mean Percentage of values March 2015 1 Within 3 standard deviations of the mean 6. Compare tables with other groups. What do you notice? March 2015 2
