ECG
advertisement
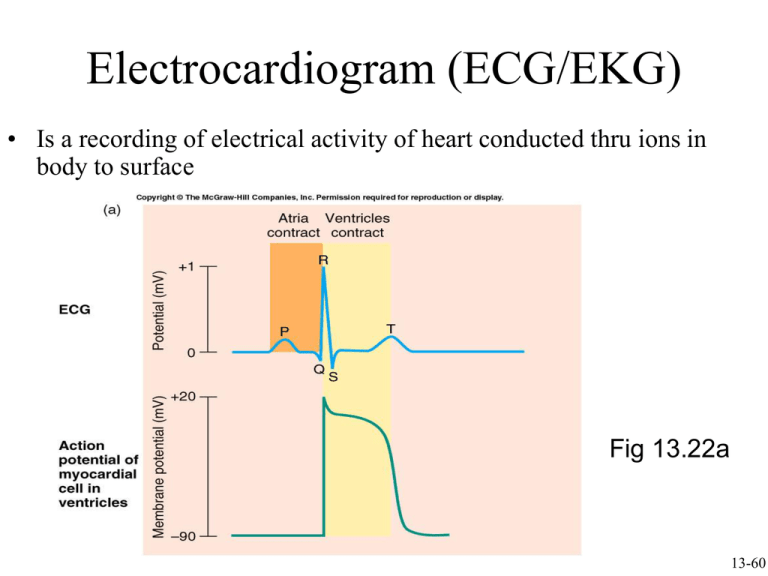
Electrocardiogram (ECG/EKG) • Is a recording of electrical activity of heart conducted thru ions in body to surface Fig 13.22a 13-60 Normal conduction pathway: SA node -> atrial muscle -> AV node -> bundle of His -> Left and Right Bundle Branches -> Ventricular muscle Types of ECG Recordings • Bipolar leads record voltage between electrodes placed on wrists & legs (right leg is ground) • Lead I records between right arm & left arm • Lead II: right arm & left leg • Lead III: left arm & left leg Fig 13.23 13-61 Fig. 13.22b ECG Leads The standard ECG has 12 leads: 3 Standard Limb Leads 3 Augmented Limb Leads 6 Precordial Leads The axis of a particular lead represents the viewpoint from which it looks at the heart. The 12-Lead System • The most commonly used clinical ECG-system, the 12-lead ECG system, consists of the following 12 leads, which are: I , II , III aVR , aVL , aVF V1 ,V2 ,V3 ,V4 ,V5 ,V6 Standard Limb Leads Augmented Limb Leads Precordial Leads Adapted from: www.numed.co.uk/electrodepl.html All Limb Leads Elements of the ECG: • P wave: Depolarization of both atria; • Relationship between P and QRS helps distinguish various cardiac arrhythmias • Shape and duration of P may indicate atrial enlargement • PR interval: from onset of P wave to onset of QRS • Normal duration = 0.12-2.0 sec (120-200 ms) (3-4 horizontal boxes) • Represents atria to ventricular conduction time (through His bundle) • Prolonged PR interval may indicate a 1st degree heart block • QRS complex: Ventricular depolarization • Larger than P wave because of greater muscle mass of ventricles • Normal duration = 0.08-0.12 seconds • Its duration, amplitude, and morphology are useful in diagnosing cardiac arrhythmias, ventricular hypertrophy, MI, electrolyte derangement, etc. • Q wave greater than 1/3 the height of the R wave, greater than 0.04 sec are abnormal and may represent MI ST segment: • Connects the QRS complex and T wave • Duration of 0.08-0.12 sec (80-120 msec T wave: • Represents repolarization or recovery of ventricles • Interval from beginning of QRS to apex of T is referred to as the absolute refractory period QT Interval • Measured from beginning of QRS to the end of the T wave • Normal QT is usually about 0.40 sec • QT interval varies based on heart rate Elements of the ECG: • P wave • Depolarization of both atria; • Relationship between P and QRS helps distinguish various cardiac arrhythmias • Shape and duration of P may indicate atrial enlargement •QRS complex: • Represents ventricular depolarization • Larger than P wave because of greater muscle mass of ventricles • Normal duration = 0.08-0.12 seconds • Its duration, amplitude, and morphology are useful in diagnosing cardiac arrhythmias, ventricular hypertrophy, MI, electrolyte derangement, etc. • Q wave greater than 1/3 the height of the R wave, greater than 0.04 sec are abnormal and may represent MI • PR interval: • From onset of P wave to onset of QRS • Normal duration = 0.12-2.0 sec (120-200 ms) (3-4 horizontal boxes) • Represents atria to ventricular conduction time (through His bundle) • Prolonged PR interval may indicate a 1st degree heart block T wave: • Represents repolarization or recovery of ventricles • Interval from beginning of QRS to apex of T is referred to as the absolute refractory period ST segment: • Connects the QRS complex and T wave • Duration of 0.08-0.12 sec (80-120 msec QT Interval • Measured from beginning of QRS to the end of the T wave • Normal QT is usually about 0.40 sec • QT interval varies based on heart rate Fig. 13.24b Fig. 13.24c Fig. 13.24d Fig. 13.24g The normal electrocardiogram
