(3035KB)
NCEA Level 2 Geography (91243) 2012 — page 1 of 11
Assessment Schedule
– 2012
Geography: Apply geography concepts and skills to demonstrate understanding of a given environment (91243)
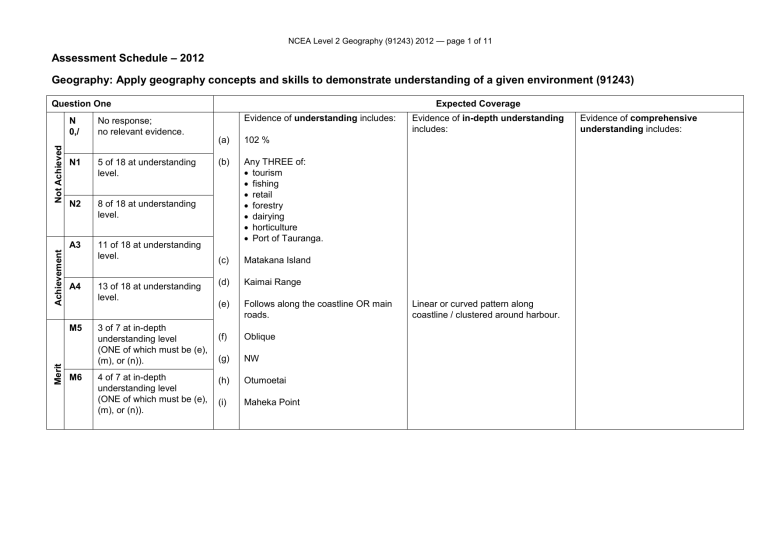
Question One
N
0,/
N1
N2
A3
A4
No response; no relevant evidence.
5 of 18 at understanding level.
8 of 18 at understanding level.
11 of 18 at understanding level.
13 of 18 at understanding level.
M5 3 of 7 at in-depth understanding level
(ONE of which must be (e),
(m), or (n)).
M6 4 of 7 at in-depth understanding level
(ONE of which must be (e),
(m), or (n)).
(e)
(f)
(g)
(h)
(i)
(c)
(d)
(a)
(b)
Evidence of understanding includes:
102 %
Any THREE of:
tourism
fishing
retail
forestry
dairying
horticulture
Port of Tauranga.
Matakana Island
Kaimai Range
Follows along the coastline OR main roads.
Oblique
NW
Otumoetai
Maheka Point
Expected Coverage
Evidence of in-depth understanding includes:
Linear or curved pattern along coastline / clustered around harbour.
Evidence of comprehensive understanding includes:
NCEA Level 2 Geography (91243) 2012 — page 2 of 11
E7 (j) at comprehensive understanding level, plus
(e), (m), or (n) at in-depth understanding level
OR:
(n) at comprehensive understanding level, plus
THREE other responses at in-depth understanding level.
E8 (j) AND (n) at comprehensive understanding level.
(k)
(l)
(m)
(j)
(n)
Précis map:
(i) Coastline at understanding level
(ii) Tauranga Airport at understanding level
(iii) Oxidation ponds at understanding level
(iv) Kopukairua at understanding level
(v) Waikareao Estuary
(see Appendix A ).
4.4 km (accept 4.3
–4.5 km).
831231 (+1 on 3rd and 6th digits).
Recognition that harbour has large areas of shallows OR sand / shingle, so channel needs to be clearly marked for ships.
Explains that Tauranga City’s layout has resulted from its location – some evidence from map (see Appendix B ).
Précis map:
(i) Coastline at detailed level
(ii) Tauranga Airport at detailed level
(iii) Oxidation ponds at detailed level
(iv) Kopukairua at detailed level (see
Appendix A ).
Recognition that harbour has large areas of shallows AND sand / shingle, so channel needs to be clearly marked for ships – some supporting evidence from map.
Detailed explanation that Tauranga
City’s layout has resulted from its location – detailed supporting evidence from map (see Appendix B ).
Précis map:
THREE of (i), (ii), (iii), or (iv) at detailed level (see Appendix A ).
Comprehensive explanation that
Tauranga City’s layout has resulted from its location – range of points covered, detailed supporting evidence from map; shows insight; and uses geographic terminology
(see Appendix B ).
NCEA Level 2 Geography (91243) 2012 — page 3 of 11
Question Two
N
0,/
N1
A3
A4
M5
M6
E7
No response; no relevant evidence.
ONE or more parts have relevance, but are insufficiently correct.
N2 1 of 4 at understanding level.
2 of 4 at understanding level.
3 of 4 at understanding level.
2 of 4 at in-depth understanding level.
3 of 4 at in-depth understanding level.
2 of 4 at comprehensive understanding level.
E8 3 of 4 at comprehensive understanding level.
(d)
(b)
(c)
(a)
Evidence of understanding includes:
Double-line graph with FOUR of the following elements (see Appendix C ):
(1) Title (MUST include what it is, BOTH subjects and time period)
(2) All axes have even scales: (vertical axes beginning at 0)
(3) Axes correctly labelled
(4) TWO lines beginning at 1961
(5) Lines identified
(6) At least THREE correct for Tauranga
(check the accuracy)
(7) At least THREE correct for New
Zealand (check the accuracy).
Comparison general: population growth of
Tauranga is much faster than for New
Zealand; BOTH settings mentioned.
TWO differences stated; some general evidence used:
(1) Tauranga has more people in the
65 years+ age group, compared with the rest of New Zealand.
(2) Tauranga has fewer in 5 –14 age group.
Brief explanation of climate being a reason why people would choose to live there.
Expected Coverage
Evidence of in-depth understanding includes:
Double-line graph with FIVE of the elements given in the evidence for
Achievement.
Detailed comparisons of Tauranga and New Zealand growth; some specific evidence.
TWO differences stated; some specific evidence used:
(1) Tauranga has more people in the 65 years+ age group at
17.4 %, compared with the rest of New Zealand.
(2) Tauranga has fewer in 5 –14 age group at 14.2 %.
Explanation of climate being a reason why people would choose to live there; some specific evidence used.
Evidence of comprehensive understanding includes:
Double-line graph with SIX of the elements given in the evidence for
Achievement.
Detailed comparisons of Tauranga and
New Zealand growth, including future growth predictions; use of specific evidence.
TWO differences stated using specific evidence for BOTH subjects within answer:
(1) Tauranga has more people in the
65 years+ age group at 17.4 %, compared with the rest of New
Zealand at 14.1 %.
(2) Tauranga has fewer in 5 –14 age group at 14.2 %, compared with the rest of New Zealand at 15.5 %.
Detailed explanation of climate being a reason why people would choose to live there; use of specific evidence integrated throughout.
Question Three
N
0,/
N1
M6
No response; no relevant evidence.
N2 1 of 3 at understanding level.
A3 2 of 3 at understanding level.
A4
M5
ONE or more parts attempted, but insufficiently correct.
ALL 3 at understanding level.
2 of 3 at in-depth understanding level.
(a)
(b)
ALL 3 at in-depth understanding level.
E7 2 of 3 at comprehensive understanding level.
E8 ALL 3 at comprehensive understanding level.
Evidence of understanding includes:
(i) Explanation of characteristics of the natural environment that have contributed to
Tauranga’s population growth.
Some supporting evidence used (see Appendix D ).
(ii) Explanation of characteristics of the cultural environment that have contributed to
Tauranga’s population growth.
Some supporting evidence used (see Appendix D ).
Explanation of Geographic
Concept of “Change” to the natural OR cultural environment.
Some supporting evidence used
(see Appendix D ).
NCEA Level 2 Geography (91243) 2012 — page 4 of 11
Expected Coverage
Evidence of in-depth understanding includes:
(i) Detailed explanation of characteristics of the natural environment that have contributed to
Tauranga’s population growth.
Detailed supporting evidence used
(see Appendix D ).
(ii) Detailed explanation of characteristics of the cultural environment that have contributed to
Tauranga’s population growth.
Detailed supporting evidence used
(see Appendix D ).
Detailed explanation of Geographic
Concept of “Change” to the natural OR cultural environment.
Reference made to how landscape will be changed in the future.
Detailed supporting evidence used (see
Appendix D ).
Evidence of comprehensive understanding includes:
(i) Comprehensive explanation of characteristics of the natural environment that have contributed to
Tauranga’s population growth.
A range of points covered using geographic terminology.
Detailed supporting evidence is integrated throughout answers; shows insight (see Appendix D ).
(ii) Comprehensive explanation of characteristics of the cultural environment that have contributed to
Tauranga’s population growth.
A range of points covered using geographic terminology.
Detailed supporting evidence is integrated throughout answers; shows insight (see Appendix D ).
Comprehensive explanation of
Geographic Concept of “Change” to the natural AND cultural environment.
Reference made to how landscape will be changed in the future.
A range of points covered using geographic terminology.
Detailed supporting evidence is integrated throughout answers; shows insight (see Appendix D ).
Judgement Statement
Not Achieved
Score range
Codes
U
D
=
=
C
S
=
=
0 – 6
Shows understanding
Shows detailed understanding
Shows comprehensive understanding
Specific evidence
NCEA Level 2 Geography (91243) 2012 — page 5 of 11
Achievement
7 – 12
Achievement with Merit
13 – 18
Achievement with Excellence
19 – 24
NCEA Level 2 Geography (91243) 2012 — page 6 of 11
Appendix A – Question One (j)
NCEA Level 2 Geography (91243) 2012 — page 7 of 11
NCEA Level 2 Geography (91243) 2012 — page 8 of 11
Appendix B – Question One (n)
Fully explain how the layout of Tauranga has been affected by its location .
Understanding (brief explanation)
Tauranga is located around the harbour and Mount Maunganui, and follows the coastline, so it is quite spread out. There are bridges across the water to join parts together.
In-depth understanding (detailed explanation with supporting evidence)
Tauranga City has been built around the bays of Tauranga Harbour like Welcome Bay and Waikareao Estuary, with housing built right up to the edge. Then there is a lot of residential area at Mount Maunganui and Papamoa following along the coast, so the city is quite spread out. Roads, such as SH2 and the bridge near Wharetoa
Point, have joined the city together to improve access, and the airport has been built on the flat land beside the harbour.
Comprehensive understanding (comprehensive explanation with detailed supporting evidence, showing insight, and using geographic terminology)
The physical environment of Tauranga Harbour, with its estuaries and bays, and ocean to the east, has determined Tauranga City’s location. The city is concentrated close to the coast and makes a curved linear pattern, following the coastline in the areas of Mount Maunganui, or around bays like Welcome Bay, so people can take advantage of the flat land and sea views. Several bridges that link land areas such as the SH2 bridge at Maungatapu increase accessibility to the different parts of the city. The airport is built on flat land near the industrial area, and both are close to the port, away from the main residential area of Tauranga. The port is protected from the ocean by being inside the harbour.
Other points could include discussion of road patterns – grid pattern in parts, with curved road patterns in other parts; influence of relief – hills to the west and less flat land – city spreading along coast due to sea views and more available flat land.
Appendix C – Question Two (a)
NCEA Level 2 Geography (91243) 2012 — page 9 of 11
NCEA Level 2 Geography (91243) 2012 — page 10 of 11
Appendix D – Question Three
Understanding (explanation of Geographic Concept of “Environment” with some supporting evidence)
(a) (i) Natural environment characteristics:
Tauranga ’s climate helps contribute to the rapid population growth as it gets a large amount of sunshine hours and is also generally warm. Omanu Beach also attracts people to live there as it creates recreation opportunities for people living in the area.
(a) (ii) Cultural environment characteristics:
The Port is important for the different economic activities in and around Tauranga. These activities include horticulture and tourism and they create jobs in the area, which is a reason for the growth of Tauranga’s population.
(b) “Changes” to the natural and cultural environment:
The significant increase in population will result in an increase in housing. More vehicles on the roads will mean more roads such as the Eastern Link. Age structure will be different with the population expected to get older, and that group of people will require a more specific range of services than the rest of the population. Changes to natural environment relate to increased population – with increased population there will be pressure on the beaches. The harbour may have issues with water quality.
In-depth understanding (detailed explanation of Geographic Concept of “Environment” with detailed supporting evidence)
(a) (i) Natural environment characteristics:
Tauranga ’s climate helps contribute to the rapid population growth as it gets a large amount of sunshine hours (2 260) and is also generally warm. Mount
Maunganui is a natural feature that attracts tourists to the area, and tourism creates jobs. The beaches and bays also attract people to live there and this, coupled with the ranges to the west, creates recreation opportunities for people living in the area.
(a) (ii) Cultural environment characteristics:
The Port of Tauranga is important for the different economic activities in and around Tauranga. These activities include horticulture and tourism and they create jobs in the area, which is a reaso n for the growth of Tauranga’s population. The cafe lifestyle also attracts people to the area and is one reason why older
(65 years+) people live there. Because tourist cruise ships dock in the harbour, many jobs are created in the tourist industry, which could be another reason to live in Tauranga.
(b) “Changes” to the natural and cultural environment:
There will be significant changes to the population with an expected future increase of 102 %, meaning more houses will need to be built. More vehicles on the roads will mean more roads are needed as well to move people around (Tauranga Eastern Link). This will enable the port to grow and the economy will get an
$8.5 billion boost. Age structure will be different with the population expected to get older, and that group of people will require a more specific range of services than the rest of the population. Commercial areas will also increase with more shops and offices. With increased population there will be changes to the natural environment. Pressure on the beaches will occur as more people will visit them. The Tauranga Harbour may have issues with water quality.
NCEA Level 2 Geography (91243) 2012 — page 11 of 11
Comprehensive understanding (comprehensive explanation of Geographic Concept of “Change” with detailed supporting evidence, showing insight, and using geographic terminology)
(a) (i) Natural environment characteristics:
Taurang a’s climate helps contribute to the rapid population growth as it gets a large amount of sunshine hours (2 260) and is also generally warm (19.1°C in
January). Mount Maunganui is a natural feature that attracts tourists to the area, and tourism creates jobs. The beaches such as Omanu and Papamoa, and bays, also attract people to live there, and this, coupled with the Kaimai Ranges to the west, creates recreation opportunities for people living in the area.
(a) (ii) Cultural environment characteristics:
The Port of Tauranga is important for the different economic activities in and around Tauranga. These activities include horticulture and tourism and they create jobs in the area, which is a reason for the growth of Tauranga’s population. The cafe lifestyle also attracts people to the area and is one reason why older
(65 years+) people live there. Because tourist cruise ships dock in the harbour, many jobs are created in the tourist industry, which could be another reason to live in Tauranga. There are six bridges in Tauranga and these have increased accessibility around the city making it easier to live there.
(b) “Changes” to the natural and cultural environment:
There will be significant changes to the population with an expected future increase of 102 % and a 118 % increase in dwellings. More vehicles on the roads will mean more roads are needed to move people around (Tauranga Eastern Link). This will enable the port to grow and the economy will get an $8.5 billion boost.
Age structure will be different with the population expected to get older (35 000 over 80 years), and that group of people will require a more specific range of services than the rest of the population. Commercial areas will also increase with more shops and offices covering 100 000 square metres. With an increased population, there will be changes to the natural environment. Pressure on the beaches such as Omanu will occur, as more people will visit them. The Tauranga
Harbour may have issues with water quality due to increased port activity or increased run-off. There will be less open space, as residential housing will have extended along the coast as Wairakei is built.


