2004 Exam I
advertisement
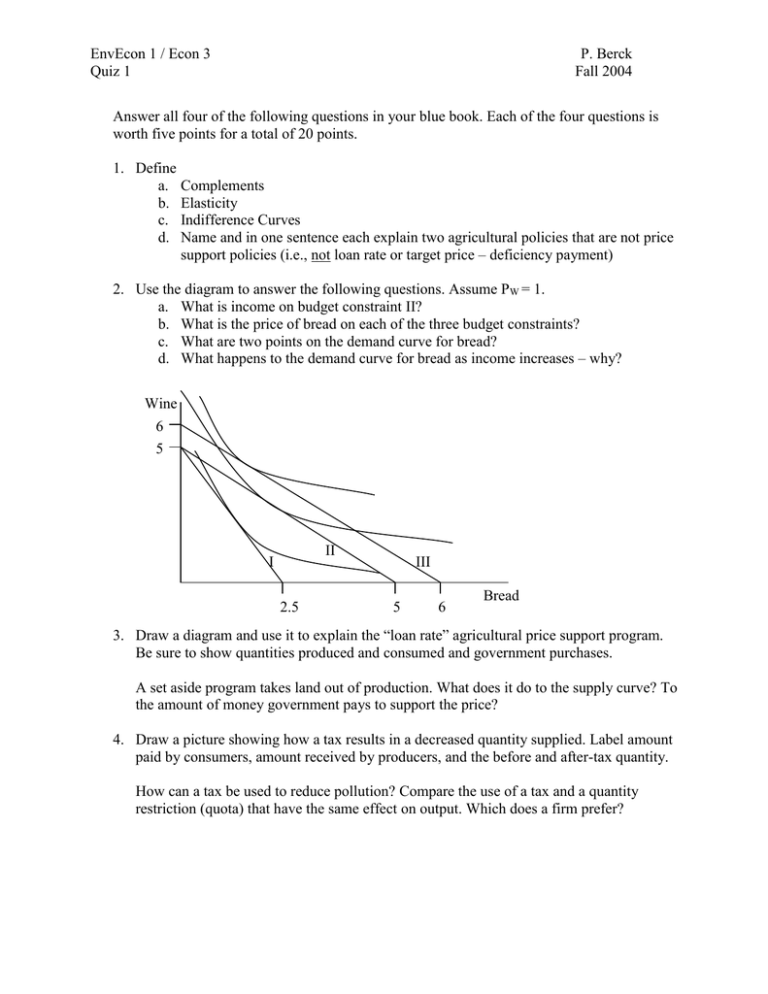
EnvEcon 1 / Econ 3 Quiz 1 P. Berck Fall 2004 Answer all four of the following questions in your blue book. Each of the four questions is worth five points for a total of 20 points. 1. Define a. Complements b. Elasticity c. Indifference Curves d. Name and in one sentence each explain two agricultural policies that are not price support policies (i.e., not loan rate or target price – deficiency payment) 2. Use the diagram to answer the following questions. Assume PW = 1. a. What is income on budget constraint II? b. What is the price of bread on each of the three budget constraints? c. What are two points on the demand curve for bread? d. What happens to the demand curve for bread as income increases – why? Wine 6 5 II I 2.5 III 5 6 Bread 3. Draw a diagram and use it to explain the “loan rate” agricultural price support program. Be sure to show quantities produced and consumed and government purchases. A set aside program takes land out of production. What does it do to the supply curve? To the amount of money government pays to support the price? 4. Draw a picture showing how a tax results in a decreased quantity supplied. Label amount paid by consumers, amount received by producers, and the before and after-tax quantity. How can a tax be used to reduce pollution? Compare the use of a tax and a quantity restriction (quota) that have the same effect on output. Which does a firm prefer?
