5. DAMAGED AREA ESTIMATION BASED ON DMSP/OLS NIGHTTIME IMAGERY AND AERIAL RECONNAISSANCE
advertisement
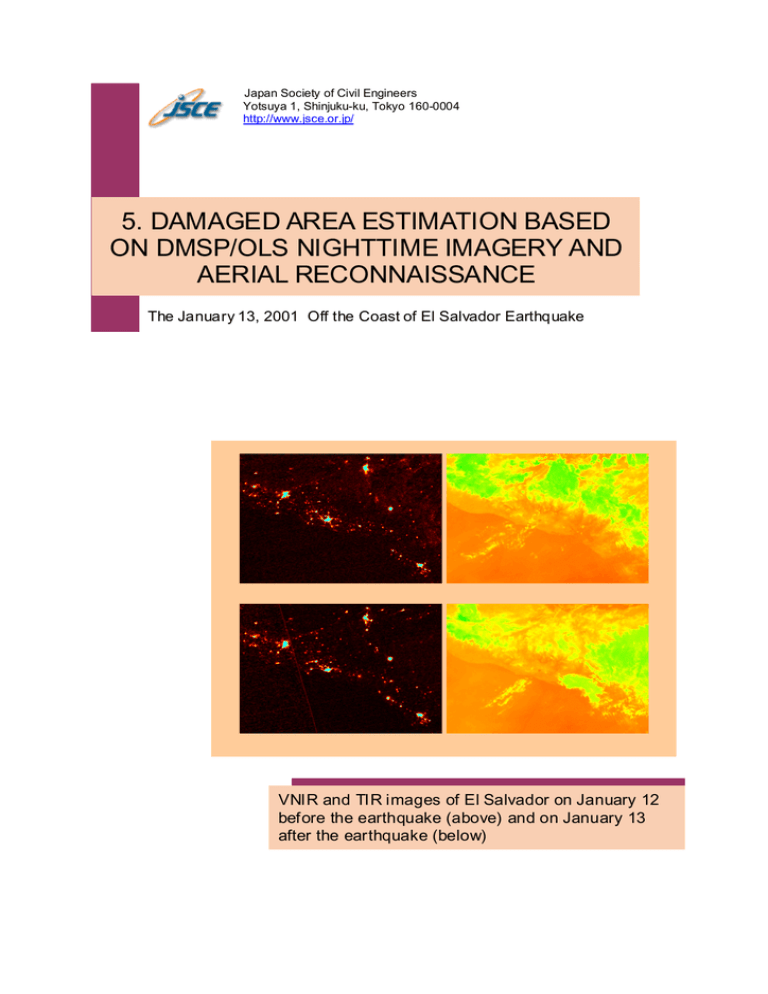
Japan Society of Civil Engineers Yotsuya 1, Shinjuku-ku, Tokyo 160-0004 http://www.jsce.or.jp/ 5. DAMAGED AREA ESTIMATION BASED ON DMSP/OLS NIGHTTIME IMAGERY AND AERIAL RECONNAISSANCE The January 13, 2001 Off the Coast of El Salvador Earthquake VNIR and TIR images of El Salvador on January 12 before the earthquake (above) and on January 13 after the earthquake (below) The January 13, 2001, El Salvador Earthquake 5.1 INTRODUCTION EDM (Earthquake Disaster Mitigation Research Center) have developed EDES (Early Disaster Estimation System) using DMSP/OLS (Defense Meteorological Satellite Program’s Operational Linescan System) nighttime imagery. EDES presented the estimated damaged areas in El Salvador on January 17 when was 4 days after the earthquake. JSCE reconnaissance team made an aerial survey by helicopter based on the map of the estimated damage area by EDES to understand the distribution of the earthquake-induced damage for buildings, infrastructures and landslides in El Salvador. 5.2 DAMAGED AREA ESTIMATION BASED ON DMSP/OLS NIGHTTIME IMAGERY After an earthquake, spatial distribution of damaged areas is indispensable information for disaster management. Response and relief actions should be supported by efficient resource allocation based on spatial information. Hayashi et al. (2000) and Kohiyama et al. (2000) proposed estimation method of earthquake-damaged areas using the Defense Meteorological Satellite Program’s Operational Linescan System (DMSP/OLS) nighttime images. Significant reduction in nighttime lights can be an indication of possible impacted areas due to earthquake disasters, because of power failure, building damage, or slowdown of human activity. DMSP/OLS images are observed on a daily basis, and the short repeat period of DMSP is more suitable for the emergency use than other high-resolution satellites. The estimated damaged areas in recent major earthquake corresponded well to the reported damages considerably (Earthquake Disaster Mitigation Research Center, 2000a; Earthquake Disaster Mitigation Research Center, 2000b), so that the proposed method could be promising for rapid grasp of damaged areas. 5.3. DMSP/OLS IMAGERY DMSP/OLS nighttime imagery has two channels, visible and near-infrared (VNIR) band (0.5-0.9 um), and thermal infrared (TIR) band (10-13 um). The pixel of VNIR image has digital number (DN) ranging from 0 to 63 to represent relative light intensity. The TIR image pixel has DN ranging 0 to 255 corresponding from 190 to 310 K. Both images are re-sampled into grids system of 30 arc sec. by 30 arc sec. from the ground sample distance of 2.7 km. Each pixel is geolocated based on the geodetic subtrack of the satellite orbit, satellite altitude, OLS scan angle equations, an Earth sea level model, and digital terrain data (Elvidge et al., 1999). The estimated pixel location is quite exact, but there are a-few-pixel gaps in comparing several images. This problem is overcome by offsetting the images to the position that minimizes the variance of VNIR DN differences, which can be assumed as an index of discrepancy of two images. For this use, the pixels in the same location are assumed to have the same DN. Thus pixels with little cloud and earthquake influence should be selected. The gain settings of optical instruments are controlled and changed to observe clouds illuminated by moonlight for air navigation. The gain settings of each orbit cannot be known, but images of the consecutive nights or of the same lunar phase nights are assumed under the same gain settings, and the light intensity changes are calculated comparing DNs of two VNIR images. 101 5.4 ESTIMATION METHOD It can be expected that city lights will observably decrease after a large earthquake due to various reasons such as electricity failure, building collapses, evacuation to shelters or the suspension of commercial activities. Therefore, the significant reduction in nighttime lights can be an indication of possible impacted areas due to earthquake disasters. The satellite images observed by the DMSP/OLS are suitable for the early identification of the damaged areas for following reasons: 1) Due to the sensitive scanner, nighttime images are available. 2) The nighttime images are observed, at least, twice a day by two DMSP satellites. These mean that we could detect significant reduction in nighttime lights at any day on a daily basis. The DMSP/OLS imagery has spatial resolution of 2.7km, and the resolution is not as high as that of the Landsat/TM or the SPOT/HRV. But the recurrent periods of the satellites with high-resolution sensors are more than two weeks and the chances to observe the image immediately after a disaster are very low. Consequently, the short recurrent period is necessary for emergency use of the observed imagery. Epicenter Data Determine Target Area VNIR Images Clip Night Light Images of Target Area Adjust Geo-References TIR Images Check Cloud Influence Stable Light Images Calculate Differences in Light Intensities Estimate Damaged Area Based on Significant Test Draw Map of Estimated Result Digital Map Disseminate Result through Internet Figure 5.1 Flowchart of damaged area estimation. The steps of damaged area estimation are shown in Figure 5.1. Each pixel in the visible-near infrared (VNIR) images has digital number (DN) ranging from 0 to 63. We calculated the differences of DNs on a pixel basis between before and after the earthquake in the sampled area. The cloud influences were checked using the thermal infrared (TIR) images and the stable light images. Based on the histogram of the differences, the areas that show the reduction in nighttime lights with p > 0.995 were determined as significant reduction due to the earthquake disaster (Figure 5.2). 102 Number of Pixels (Frequency) Normal distribution based on sample pixels Threshold (p>99.5%) Estimated damaged areas O Difference of digital numbers (change of brightness) Figure 5.2 Criteria of damaged area estimation. 5.5. ESTIMATION RESULTS We estimated the possible impacted areas of the earthquake disaster. The DMSP/OLS images in this region were provided from National Oceanic and Atmospheric Administration’s National Geophysical Data Center (NOAA/NGDC). The nighttime VNIR and TIR images on January 12 (before the earthquake), January 13 and 14 (after the earthquake) are shown in Figures 5.3, 5.4 and 5.5, respectively. The histogram of digital number differences between two VNIR images on January 12 and 13 is shown in Figure 5.6. The similar figure between January 12 and 14 is shown in Figure 5.7. The thresholds of p > 95% and 99% are used to estimate damaged areas. The estimated impacted areas based on Figure 6 (between January 12 and 13) and on Figure 5.7 (between January 12 and 14) are shown in Figure 5.8 and 5.9, respectively. The estimated impacted areas spread around San Salador and eastern area including Usulután and San Miguel widely in Figure 5.8. In a few days after the earthquake, there was a countrywide power cut due to the damage of the transmissions and sub-stations facility (see chapter 5) so that the decrease in light intensity in the post-event images seems to reflect that influence. Because of recovery of electric power, the estimated impacted area including Usulután and San Miguel decrease after 2 days (Figure 5.9). The disaster damage reported by COEN (Comité de Emergencia Nacional, 2001) is shown in Table 1. The map of prefectures in El Salvador is shown in Figure 5.10. The number of collapsed buildings in La Libertad, La Paz, Sonsonate, Usulután and San Salvador was over 10,000. These prefectures contained most of the estimated damaged cities in Figure 5.9. The estimation result showed with a high degree of correspondence with the real damage distribution. Hundreds of houses were buried due to a large landslide in Nueva San Salvador. The damage was estimated based on January 13 (Figure 5.8), on the other hand, the area could no be estimated because of the data saturation. It is difficult for this method to estimate the damage in highly populated area such as Nueva San Salvador. 103 Legend for VNIR 0 20 40 60 Legend for TIR -80 -60 -40 (a) VNIR image (b) TIRimage Figure 5.3 VNIR and TIR images on January 12 before the earthquake (a) VNIR image (b) TIRimage Figure 5.4 VNIR and TIR images on January 13 after the earthquake (a) VNIR image (b) TIRimage Figure 5.5 VNIR and TIR images on January 14 after the earthquake 104 -20 0 20 ( ℃) 10000 Normal distribution based on sample data p > 95% Frequency 1000 p > 99% 100 10 1 -60 -50 -40 -30 -20 -10 0 10 20 30 40 50 60 Differences of VNIR DNs (January 13 – January 12) Figure 5.6 Histogram of digital number differences between two images on January 12 and 13 10000 Normal distribution based on sample data p > 95% Frequency 1000 p > 99% 100 10 1 -60 -50 -40 -30 -20 -10 0 10 20 30 40 50 60 Differences of VNIR DNs (January 14 – January 12) Figure 5.7 Histogram of digital number differences between two images on January 12 and 14 105 Figure 5.8 Estimated damaged area using two images on January 12 and 13. Figure 5.9 Estimated damaged area using two images on January 12 and 14. 106 Table 5.1 Damage statistics (Comité de Emergencia Nacional, 2001) Damaged Damaged Collapsed Prefecture Death Injured public houses houses buildings La Libertad 685 2183 48 14558 15723 La Paz 44 147 272 25076 17996 Sonsonate 48 1295 38 17773 10501 Santa Ana 47 327 5 13925 4823 Cuscatlán 20 43 47 4762 4282 Usulután 27 786 335 30716 29293 San Salvador 24 391 76 12836 10372 San Miguel 19 43 23 10624 2902 San Vicente 29 81 40 17292 5218 La Unión 1 8 98 2136 268 Ahuachapán 0 247 60 18540 6553 Cabañas 0 7 31 1153 309 Morazán 0 3 35 94 5 Chalatenango 0 4 47 307 16 TOTAL 944 5565 1155 169692 108261 Buried houses Refuge 687 0 0 0 0 0 0 0 0 0 0 0 0 1 688 147708 232135 101487 112561 38119 356391 107083 76665 103086 13094 71086 2997 498 1250 1364160 N HONDURAS GUATEMALA W E S CHALATENANGO SANTA ANA CUSCATLAN AHUACHAPAN CABANAS MORAZAN SAN SALVADOR SONSONATE LA LIBERTAD SAN VICENTE LA PAZ SAN MIGUEL LA UNION USULUTAN EL SALVADOR Pacific Ocean 100 0 Figure 5.10 Prefecture boundary in El Salvador 107 NICARAGUA 100 km 5.6 AERIAL RECONNAISSANCE JSCE reconnaissance team made an aerial survey by helicopter on February 3. The El Salvador military gave the team members a lift on a helicopter. The purpose of the flight was to obtain the overview of the geo-hazards, damage of buildings and infrastructures. The flight path is roughly illustrated in Figure 11. We departed from San Salvador military airport, and surveyed from the western area to eastern area in El Salvador. The cities of Santa tecla, San Salvador, Zacatecolca and San Miguel and the small towns of Jayaque, Comasagua, San Agustin and Santiago De Maria are located on the flight path. The overview of the damage of buildings and infrastructures will be described in this section. Figure 5.11 Helicopter flight route The overview of the damage distribution of buildings and infrastructures is summarized as follows. 1) In western area of San Salvador, dwellings at small mountain villages such as Tepecoyo, Jayaque, Talnique and Comasagua in La Libertad suffered serious damages due to strong ground motion and landslide (Figure 5.12). 2) Las Colinas landslide destroyed hundreds of houses and killed over 500 people in Nueva San Salvador (Figure 5.13). 3) In eastern area of San Salvador, dwellings at towns such as San Juan Nonualco and Zacatecoluca in La Paz suffered slight damages of roofs and walls (Figure 5.14). 3) San Marcos Bridge on Lempa River was slightly damaged with subsidence of back fill soil behind the abutment. The girder of the old railway bridge close to San Marcos Bridge fell down due to the horizontal displacement of the riverside ground (Figure 5.15). The cracks and sand boils were shown in some places along Lempa River (Figure 5.16). 108 4) Dwellings at mountain villages such as San Augstin and Santiago de Maria in Usulután suffered damages (Figure 5.17, Figure 5.18). Especially, most of dwellings such as unreinforced adobe and bahareque houses were collapsed at San Augstin. 5) No major damages were observed in San Miguel City, which is one the largest city in eastern area (Figure 5.19). Figure 5.12 Collapsed houses at Jayaque village in La Libertad Figure 5.13 Las Colinas landslide in La Libertad Figure 5.14 Damaged houses at San Juan Nonualco in La Paz Figure 5.15 Damaged bridges on Lempa River Figure 5.16 Liquefaction-induced sand boils along Lempa River Figure 5.17 Collapsed houses at San Augstin in Usulután 109 Figure 5.18 Damaged houses at Santiago de Maria in Usulután Figure 5.19 No major damage in San Miguel City ACKNOWLEDGEMENTS The DMSP/OLS images used in this study are provided by National Oceanic and Atmospheric Administration’s National Geophysical Data Center (NOAA/NGDC). The authors wish to thank Mr. Masayuki Kohiyama, NOAA/NGDC and Dr. Haruhiro Fujita for the cooperation. REFERENCES Comité de Emergencia Nacional: http://www.coen.gob.sv/Final130101.htm, 2001. Elvidge, C.D., Baugh, K.E., Kihn, E.A., Kroehl, H.W., and Davis, E.R. (1999). “Mapping City Lights with Nighttime Data from the DMSP Operational Linescan System,” Photogramm. Eng. & Remote Sens., 63(6), 727-734. Earthquake Disaster Mitigation Research Center: Report on the Kocaeli, Turkey Earthquake of August 17, 1999, 2000a. Earthquake Disaster Mitigation Research Center: Report on the Chi-Chi, Taiwan Earthquake of September 21, 1999, 2000b. Hayashi, H., Hashitera, S., Kohiyama, M., Matsuoka, M., Maki, N., Fujita, H., Elvidge, C.D. (2000). “International Collaboration for the Early Damaged Area Estimation System Using DMSP/OLS Nighttime Images,” Proc. of the International Geoscience and Remote Sensing Symposium, IEEE. Kohiyama, M., Hayashi, H., Maki, N., Hashitera, S., Matsuoka, M., Kroehl, H.W., Elvidge, C.D., Hobson, V.R. (2000). “Development of Early Damaged Area Estimation System (EDES) Using DMSP/OLS Nighttime Imagery,” Journal of Social Safety Science, Institute of Social Safety Science, 2, 79-86 (in Japanese). to the next page 110
