Medroplan Guidelines SPI Help File
advertisement

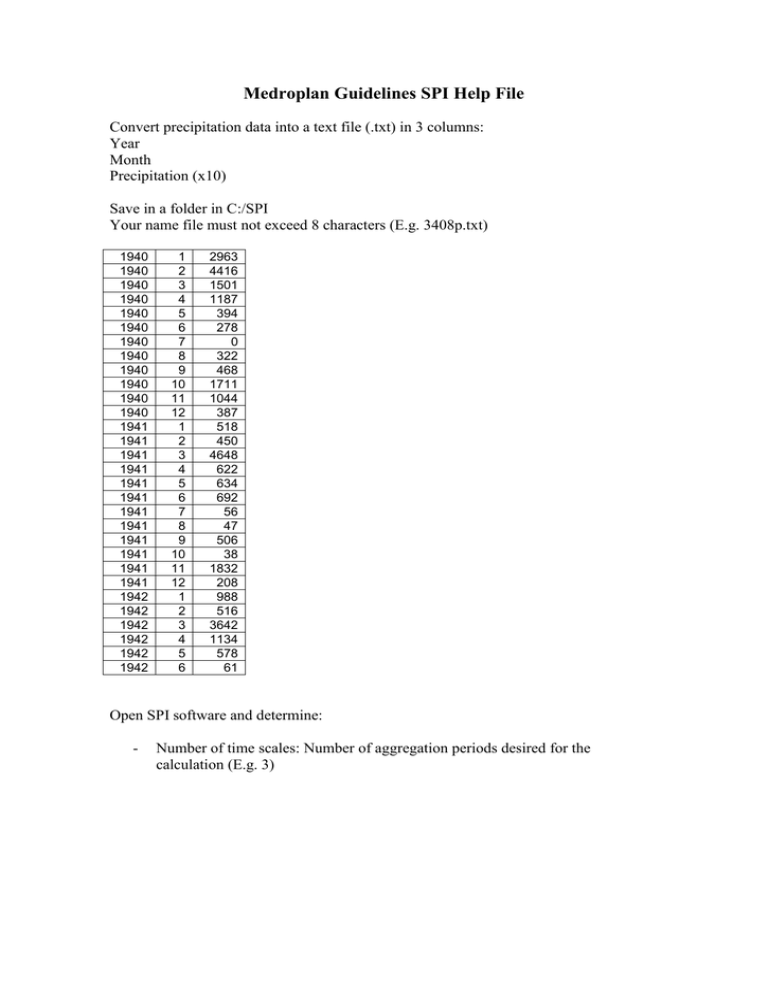
Medroplan Guidelines SPI Help File Convert precipitation data into a text file (.txt) in 3 columns: Year Month Precipitation (x10) Save in a folder in C:/SPI Your name file must not exceed 8 characters (E.g. 3408p.txt) 1940 1940 1940 1940 1940 1940 1940 1940 1940 1940 1940 1940 1941 1941 1941 1941 1941 1941 1941 1941 1941 1941 1941 1941 1942 1942 1942 1942 1942 1942 1 2 3 4 5 6 7 8 9 10 11 12 1 2 3 4 5 6 7 8 9 10 11 12 1 2 3 4 5 6 2963 4416 1501 1187 394 278 0 322 468 1711 1044 387 518 450 4648 622 634 692 56 47 506 38 1832 208 988 516 3642 1134 578 61 Open SPI software and determine: - Number of time scales: Number of aggregation periods desired for the calculation (E.g. 3) - timeScale1, 2 and 3: duration of the 3 aggregation periods selected (E.g. 3, 12 and 24 months each). Just write the number - Input file: C:\SPI\yourfile.txt (your file name must not exceed 8 characters, e.g. 3408p.txt) Output file: C:\SPI\yourfile.txt (your file name must not exceed 8 characters, e.g. 3408s.txt). The txt obtained should look similar to the following one without the column headings. - Year Month 1899 4 1899 5 1899 6 1899 7 1899 8 1899 9 1899 10 1899 11 1899 12 1900 1 1900 2 1900 3 1900 4 1900 5 1900 6 1900 7 1900 8 1900 9 1900 10 SPI 3 -99 -99 -99 -0.87 0.17 -0.16 0.7 0.39 0.31 0.23 -0.29 -0.14 -0.72 -0.35 -0.5 -0.59 -0.76 -0.07 -0.16 SPI 12 -99 -99 -99 -99 -99 -99 -99 -99 -99 -0.37 -0.2 -0.3 -0.2 -0.08 -0.18 -0.25 -0.73 -0.24 -0.75 SPI 24 -99 -99 -99 -99 -99 -99 -99 -99 -99 -99 -99 -99 -99 -99 -99 -99 -99 -99 -99 1900 1900 1901 1901 1901 1901 1901 1901 1901 1901 1901 1901 1901 1901 1902 1902 1902 11 12 1 2 3 4 5 6 7 8 9 10 11 12 1 2 3 -0.45 -1.11 -0.73 -1.08 -1 -0.12 0.3 0.72 0.63 0.64 -0.02 -0.26 0.15 -0.05 -0.48 0.58 0.7 -0.65 -1.27 -1 -1.36 -0.97 -0.32 -0.17 -0.26 -0.21 -0.55 -0.9 -0.33 0.23 0.41 -0.01 0.76 0.55 -99 -99 -1.12 -1.22 -0.98 -0.43 -0.24 -0.38 -0.38 -0.97 -0.88 -0.83 -0.35 -0.61 -0.82 -0.39 -0.3 With these results SPI graphs can be obtained in Excel defining the threshold level for drought identification as the same value for the whole series (e.g. -2) SPI a 3 meses. Est.3504. Hervas 3 2 1 -2 -3 -4 99 19 94 96 19 19 90 92 19 19 85 87 19 19 81 83 19 19 76 78 19 19 72 74 19 19 67 69 19 19 63 65 19 19 58 60 19 19 54 56 19 19 49 51 19 19 45 47 19 -1 19 19 19 40 42 0


