Econ 7331 Professor Chris Murray Econometrics 1
advertisement
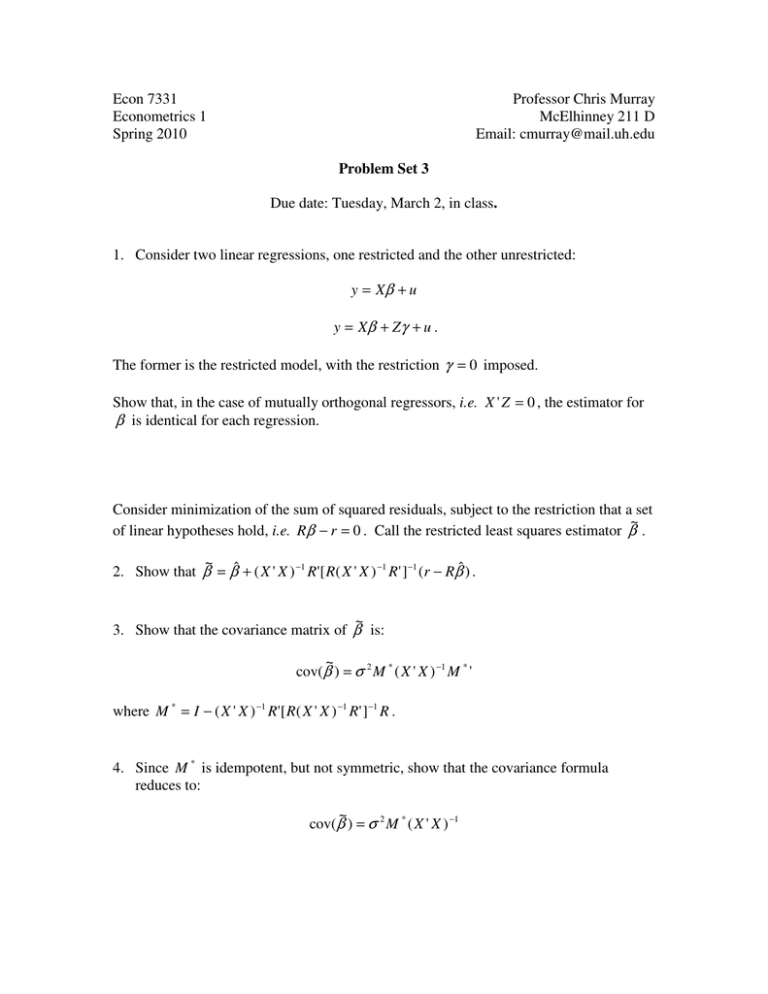
Econ 7331 Econometrics 1 Spring 2010 Professor Chris Murray McElhinney 211 D Email: cmurray@mail.uh.edu Problem Set 3 Due date: Tuesday, March 2, in class. 1. Consider two linear regressions, one restricted and the other unrestricted: y = Xβ + u y = Xβ + Z γ + u . The former is the restricted model, with the restriction γ = 0 imposed. Show that, in the case of mutually orthogonal regressors, i.e. X ' Z = 0 , the estimator for β is identical for each regression. Consider minimization of the sum of squared residuals, subject to the restriction that a set ~ of linear hypotheses hold, i.e. Rβ − r = 0 . Call the restricted least squares estimator β . ~ 2. Show that β = βˆ + ( X ' X ) −1 R '[ R ( X ' X ) −1 R ' ]−1 (r − Rβˆ ) . ~ 3. Show that the covariance matrix of β is: ~ cov(β ) = σ 2 M * ( X ' X ) −1 M * ' where M * = I − ( X ' X ) −1 R'[ R( X ' X ) −1 R' ] −1 R . 4. Since M * is idempotent, but not symmetric, show that the covariance formula reduces to: ~ cov(β ) = σ 2 M * ( X ' X ) −1 5. Consider the following regression model with Normal errors: Yi = β 0 + β 1 X 1i + β 2 X 2i + β 3 X 3i + u i where u i ~ iidN (0, σ 2 ) . a. Construct a 95% confidence interval for β 2 . Use this confidence interval to test the following hypothesis: H 0 : β 2 = 2.3 H 1 : β 2 ≠ 2.3 b. Test the following hypothesis using a t-statistic: H 0 : β2 + β3 = 5 H1 : β 2 + β 3 ≠ 5 c. Test the following hypotheses: H 0 : β 0 = 0, β 3 = 0 H 1 : β 0 ≠ 0, β 3 ≠ 0 d. Using a p-value, test the null that β 0 = 0 against the 2-sided alternative. Regression Output for Problem 5 ============================================================ Dependent Variable: Y Method: Least Squares Date: 03/12/08 Time: 15:02 Sample: 1 15 Included observations: 15 ============================================================ Variable Coefficient Std. Error t-Statistic Prob. ============================================================ C 0.445737 0.368727 1.208854 0.2521 X1 0.892575 0.171089 5.217019 0.0003 X2 2.361413 0.724042 3.261432 0.0076 X3 3.155499 0.149056 21.16995 0.0000 ============================================================ R-squared 0.995800 Mean dependent var-6.154827 Adjusted R-squared 0.994654 S.D. dependent var 18.11850 S.E. of regression 1.324742 Akaike info crit 3.623492 Sum squared resid 19.30437 Schwarz criterion 3.812305 Log likelihood -23.17619 F-statistic 869.2809 Durbin-Watson stat 1.483394 Prob(F-statistic) 0.000000 ============================================================ Coefficient Covariance Matrix ============================================================ C X1 X2 X3 ============================================================ C 0.135960 0.010335 -0.003392 0.002504 X1 0.010335 0.029271 -0.026940 -0.019129 X2 -0.003392 -0.026940 0.524237 -0.023940 X3 0.002504 -0.019129 -0.023940 0.022218 ============================================================ ============================================================ Dependent Variable: Y Method: Least Squares Date: 03/12/08 Time: 16:31 Sample: 1 15 Included observations: 15 ============================================================ Variable Coefficient Std. Error t-Statistic Prob. ============================================================ C -6.154827 4.678176 -1.315647 0.2094 ============================================================ R-squared 0.000000 Mean dependent var-6.154827 Adjusted R-squared 0.000000 S.D. dependent var 18.11850 S.E. of regression 18.11850 Akaike info crit 8.696084 Sum squared resid 4595.919 Schwarz criterion 8.743288 Log likelihood -64.22063 Durbin-Watson stat 2.336955 ============================================================ ============================================================ Dependent Variable: Y Method: Least Squares Date: 03/12/08 Time: 16:31 Sample: 1 15 Included observations: 15 ============================================================ Variable Coefficient Std. Error t-Statistic Prob. ============================================================ C 0.090116 2.278498 0.039550 0.9691 X1 3.609472 0.699869 5.157357 0.0002 X2 5.761485 4.367186 1.319267 0.2117 ============================================================ R-squared 0.824668 Mean dependent var-6.154827 Adjusted R-squared 0.795446 S.D. dependent var 18.11850 S.E. of regression 8.194568 Akaike info crit 7.221677 Sum squared resid 805.8114 Schwarz criterion 7.363287 Log likelihood -51.16257 F-statistic 28.22080 Durbin-Watson stat 2.573820 Prob(F-statistic) 0.000029 ============================================================ ============================================================ Dependent Variable: Y Method: Least Squares Date: 03/12/08 Time: 16:31 Sample: 1 15 Included observations: 15 ============================================================ Variable Coefficient Std. Error t-Statistic Prob. ============================================================ X1 3.601176 0.641539 5.613342 0.0001 X2 5.761946 4.196115 1.373162 0.1929 ============================================================ R-squared 0.824645 Mean dependent var-6.154827 Adjusted R-squared 0.811156 S.D. dependent var 18.11850 S.E. of regression 7.873600 Akaike info crit 7.088474 Sum squared resid 805.9165 Schwarz criterion 7.182880 Log likelihood -51.16355 Durbin-Watson stat 2.575678 ============================================================ ============================================================ Dependent Variable: Y Method: Least Squares Date: 03/12/08 Time: 16:31 Sample: 1 15 Included observations: 15 ============================================================ Variable Coefficient Std. Error t-Statistic Prob. ============================================================ X1 0.979464 0.220030 4.451504 0.0007 X3 3.255368 0.193977 16.78224 0.0000 ============================================================ R-squared 0.991141 Mean dependent var-6.154827 Adjusted R-squared 0.990460 S.D. dependent var 18.11850 S.E. of regression 1.769733 Akaike info crit 4.103100 Sum squared resid 40.71540 Schwarz criterion 4.197507 Log likelihood -28.77325 Durbin-Watson stat 2.179030 ============================================================ ============================================================ Dependent Variable: Y Method: Least Squares Date: 03/12/08 Time: 16:31 Sample: 1 15 Included observations: 15 ============================================================ Variable Coefficient Std. Error t-Statistic Prob. ============================================================ C 0.461016 0.495082 0.931191 0.3701 X1 1.013924 0.224238 4.521646 0.0007 X3 3.263335 0.195164 16.72102 0.0000 ============================================================ R-squared 0.991738 Mean dependent var-6.154827 Adjusted R-squared 0.990361 S.D. dependent var 18.11850 S.E. of regression 1.778848 Akaike info crit 4.166665 Sum squared resid 37.97159 Schwarz criterion 4.308275 Log likelihood -28.24999 F-statistic 720.2144 Durbin-Watson stat 2.269623 Prob(F-statistic) 0.000000 ============================================================
