Basic module details
advertisement
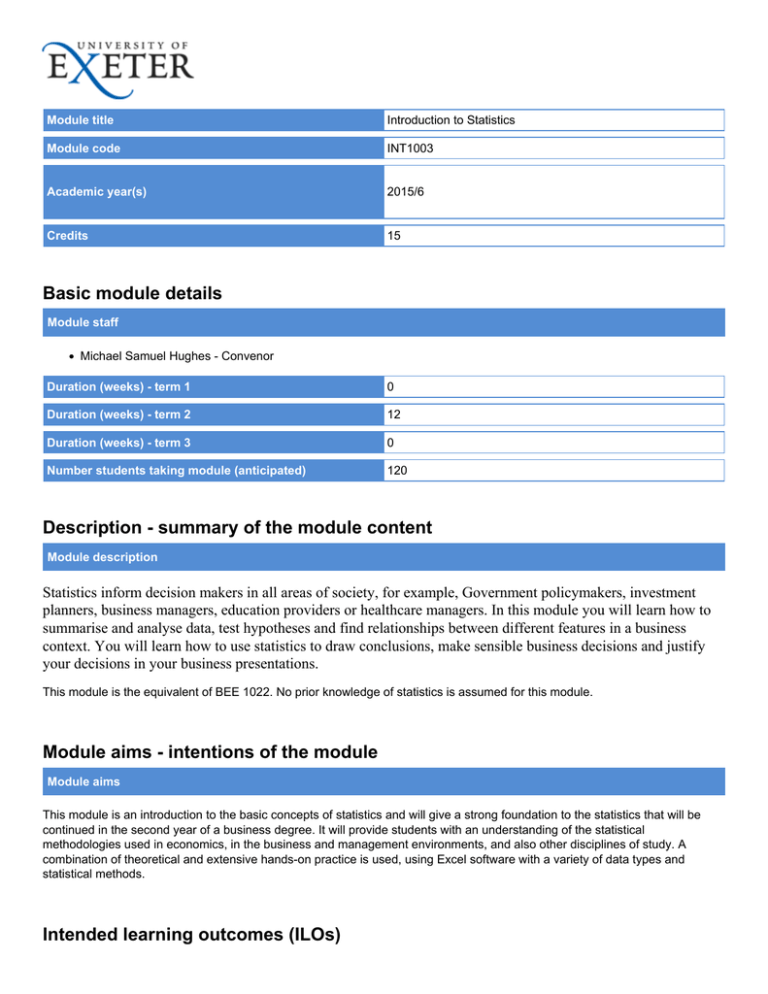
Module title Introduction to Statistics Module code INT1003 Academic year(s) 2015/6 Credits 15 Basic module details Module staff Michael Samuel Hughes - Convenor Duration (weeks) - term 1 0 Duration (weeks) - term 2 12 Duration (weeks) - term 3 0 Number students taking module (anticipated) 120 Description - summary of the module content Module description Statistics inform decision makers in all areas of society, for example, Government policymakers, investment planners, business managers, education providers or healthcare managers. In this module you will learn how to summarise and analyse data, test hypotheses and find relationships between different features in a business context. You will learn how to use statistics to draw conclusions, make sensible business decisions and justify your decisions in your business presentations. This module is the equivalent of BEE 1022. No prior knowledge of statistics is assumed for this module. Module aims - intentions of the module Module aims This module is an introduction to the basic concepts of statistics and will give a strong foundation to the statistics that will be continued in the second year of a business degree. It will provide students with an understanding of the statistical methodologies used in economics, in the business and management environments, and also other disciplines of study. A combination of theoretical and extensive hands-on practice is used, using Excel software with a variety of data types and statistical methods. Intended learning outcomes (ILOs) ILO: Module-specific skills 1. compute and graph salient features of experimental and survey data, manually and using a computer 2. carry out a hypothesis test in a variety of contexts 3. calculate basic statistics and use them to compare data sets 4. apply certain parametric and non-parametric statistical tests 5. interpret the results of certain statistical tests in a variety of situations 6. fit and interpret bivariate and multivariate regression models 7. demonstrate the ability to utilise a software package (Excel) for a range of statistical applications ILO: Discipline-specific skills 8. apply some fundamental statistical methods 9. analyse data and draw conclusions from it 10. calculate and interpret statistical parameters ILO: Personal and key skills 11. use IT effectively 12. demonstrate written communication skills 13. present information in different formats Syllabus plan Syllabus plan · · · · · · · · · · · · · Introduction to Statistics, Scales of measurement. Descriptive Statistics: Frequency Tables, Frequency Distributions. Descriptive Statistics: Numerical Measures. Descriptive Statistics: Graphical Methods. Discrete and continuous random variables. Discrete and continuous probability distributions. Classical probability concepts. Sampling Methods and the Central Limit Theorem. Estimation and Confidence Intervals. One-Sample and Two-Samples Tests of Hypothesis. Analysis of Variance. Correlation and Linear Regression. Multiple Regression. Nonparametric Methods: Goodness-of-Fit Tests. Learning and teaching Learning activities and teaching methods (given in hours of study time) Scheduled Learning and Teaching Activities Guided independent study Placement / study abroad 64 86 0 Details of learning activities and teaching methods Category Hours of study time Description Scheduled learning and teaching activities 24 Lectures (2 x 1Hr) Scheduled learning and teaching activities 36 Seminar – these will be teacher led. You should prepare for each seminar based on the related lecture Practical 4 Practice applying methods to simulated situations. Study Clinic 8 Optional sessions to reinforce key skills Guided Independent Study 42 Reading and research Guided Independent Study 12 Practice of techniques Guided Independent Study 24 Web-based activities Assessment Formative assessment Form of assessment Size of the assessment (eg length / duration) ILOs assessed Feedback method 4 case studies 1 hour each 1-13 Written Summative assessment (% of credit) Coursework Written exams Practical exams 20 80 0 Details of summative assessment Form of assessment % of credit Size of the assessment (eg length / duration) ILOs assessed Feedback method Examination 80% 2 hours 1-6,8-10, 12-13 Written Coursework assessments 20% 20 hours in total 1-13 Written & online Re-assessment Details of re-assessment (where required by referral or deferral) Original form of assessment Form of re-assessment ILOs re-assessed Timescale for reassessment Examination 1-6, 8-10, 12-13 2 weeks after original exam Re-assessment notes Written examination The pass mark for award of credit in this module is 40%. Referral or deferral is a process whereby a further attempt at the module examination, following an initial failure, is permitted without the requirement to repeat any attendance. This will constitute a second formal examination – coursework will not be included in the reassessment. Resubmission of coursework is impractical for two reasons; coursework answers and feedback are given to students after marking, and some coursework is assessing IT skills which cannot be measured by the examination process. All summative coursework must be completed before entitlement to a referral or deferral. The grade for the re-assessment, and therefore the module grade, will be capped at 40%. Resources Indicative learning resources - Basic reading Lind, D. A., Marchal, W. G. & Wathen, S. A. (2013). Basic Statistics for Business & Economics (8th Ed.). New York: McGraw Hill Irwin. Module has an active ELE page? Yes Indicative learning resources - Web based and electronic resources Course Lectures and worklog is available through ELE in addition to online assessments. http://vle.exeter.ac.uk/course/view.php?id=3291 Online exercises associated with Course textbook. http://connect.mcgraw-hill.com Indicative learning resources - Other resources Other resources, through both self research and those presented or referenced to by the lecturer Other details Module ECTS 7.5 Module pre-requisites None Module co-requisites None NQF level (module) 4 Available as distance learning? No Origin date 16/05/08 Last revision date 02/08/2013 Key words search Statistics business measurement percentages pie charts tables descriptive diagrams calculating correlation regression logarithms time charts average trends deterministic sampling distribution mean confidence intervals normally probabilities testing
