5-Feb-14 Direct and Indirect Family Holdings of Stock, by Selected Characteristics...
advertisement
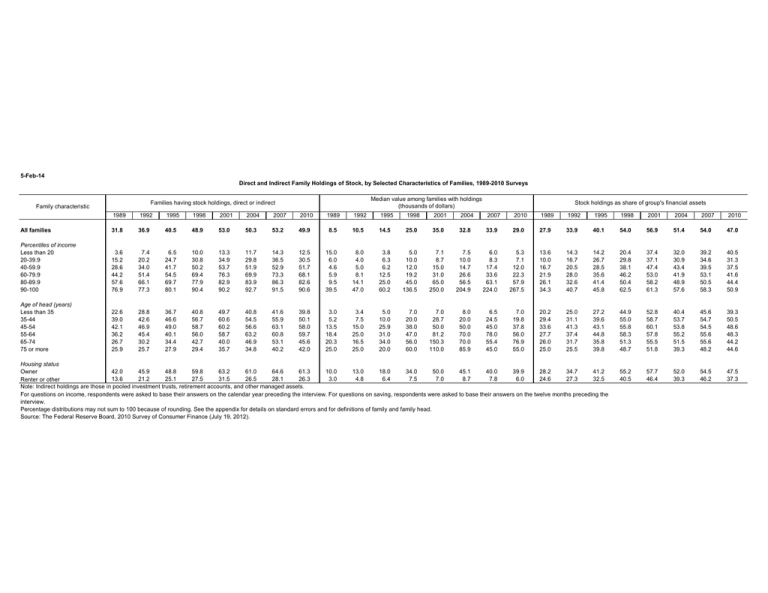
5-Feb-14 Direct and Indirect Family Holdings of Stock, by Selected Characteristics of Families, 1989-2010 Surveys Median value among families with holdings (thousands of dollars) Families having stock holdings, direct or indirect Family characteristic 1989 Stock holdings as share of group's financial assets 1989 1992 1995 1998 2001 2004 2007 2010 1992 1995 1998 2001 2004 2007 2010 1989 1992 1995 1998 2001 2004 2007 2010 All families 31.8 36.9 40.5 48.9 53.0 50.3 53.2 49.9 8.5 10.5 14.5 25.0 35.0 32.8 33.9 29.0 27.9 33.9 40.1 54.0 56.9 51.4 54.0 47.0 Percentiles of income Less than 20 20-39.9 40-59.9 60-79.9 80-89.9 90-100 3.6 15.2 28.6 44.2 57.6 76.9 7.4 20.2 34.0 51.4 66.1 77.3 6.5 24.7 41.7 54.5 69.7 80.1 10.0 30.8 50.2 69.4 77.9 90.4 13.3 34.9 53.7 76.3 82.9 90.2 11.7 29.8 51.9 69.9 83.9 92.7 14.3 36.5 52.9 73.3 86.3 91.5 12.5 30.5 51.7 68.1 82.6 90.6 15.0 6.0 4.6 5.9 9.5 39.5 8.0 4.0 5.0 8.1 14.1 47.0 3.8 6.3 6.2 12.5 25.0 60.2 5.0 10.0 12.0 19.2 45.0 136.5 7.1 8.7 15.0 31.0 65.0 250.0 7.5 10.0 14.7 26.6 56.5 204.9 6.0 8.3 17.4 33.6 63.1 224.0 5.3 7.1 12.0 22.3 57.9 267.5 13.6 10.0 16.7 21.9 26.1 34.3 14.3 16.7 20.5 28.0 32.6 40.7 14.2 26.7 28.5 35.6 41.4 45.8 20.4 29.8 38.1 46.2 50.4 62.5 37.4 37.1 47.4 53.0 58.2 61.3 32.0 30.9 43.4 41.9 48.9 57.6 39.2 34.6 39.5 53.1 50.5 58.3 40.5 31.3 37.5 41.6 44.4 50.9 Age of head (years) Less than 35 35-44 45-54 55-64 65-74 75 or more 22.6 39.0 42.1 36.2 26.7 25.9 28.8 42.6 46.9 45.4 30.2 25.7 36.7 46.6 49.0 40.1 34.4 27.9 40.8 56.7 58.7 56.0 42.7 29.4 49.7 60.6 60.2 58.7 40.0 35.7 40.8 54.5 56.6 63.2 46.9 34.8 41.6 55.9 63.1 60.8 53.1 40.2 39.8 50.1 58.0 59.7 45.6 42.0 3.0 5.2 13.5 18.4 20.3 25.0 3.4 7.5 15.0 25.0 16.5 25.0 5.0 10.0 25.9 31.0 34.0 20.0 7.0 20.0 38.0 47.0 56.0 60.0 7.0 28.7 50.0 81.2 150.3 110.0 8.0 20.0 50.0 70.0 70.0 85.9 6.5 24.5 45.0 78.0 55.4 45.0 7.0 19.8 37.8 56.0 76.9 55.0 20.2 29.4 33.6 27.7 26.0 25.0 25.0 31.1 41.3 37.4 31.7 25.5 27.2 39.6 43.1 44.8 35.8 39.8 44.9 55.0 55.8 58.3 51.3 48.7 52.8 58.7 60.1 57.8 55.5 51.8 40.4 53.7 53.8 55.2 51.5 39.3 45.6 54.7 54.5 55.6 55.6 48.2 39.3 50.5 48.6 48.3 44.2 44.6 55.2 40.5 57.7 46.4 52.0 39.3 54.5 46.2 47.5 37.3 Housing status Owner 42.0 45.9 48.8 59.8 63.2 61.0 64.6 61.3 10.0 13.0 18.0 34.0 50.0 45.1 40.0 39.9 28.2 34.7 41.2 13.6 21.2 25.1 27.5 31.5 26.5 28.1 26.3 3.0 4.8 6.4 7.5 7.0 8.7 7.8 6.0 24.6 27.3 32.5 Renter or other Note: Indirect holdings are those in pooled investment trusts, retirement accounts, and other managed assets. For questions on income, respondents were asked to base their answers on the calendar year preceding the interview. For questions on saving, respondents were asked to base their answers on the twelve months preceding the interview. Percentage distributions may not sum to 100 because of rounding. See the appendix for details on standard errors and for definitions of family and family head. Source: The Federal Reserve Board, 2010 Survey of Consumer Finance (July 19, 2012).
