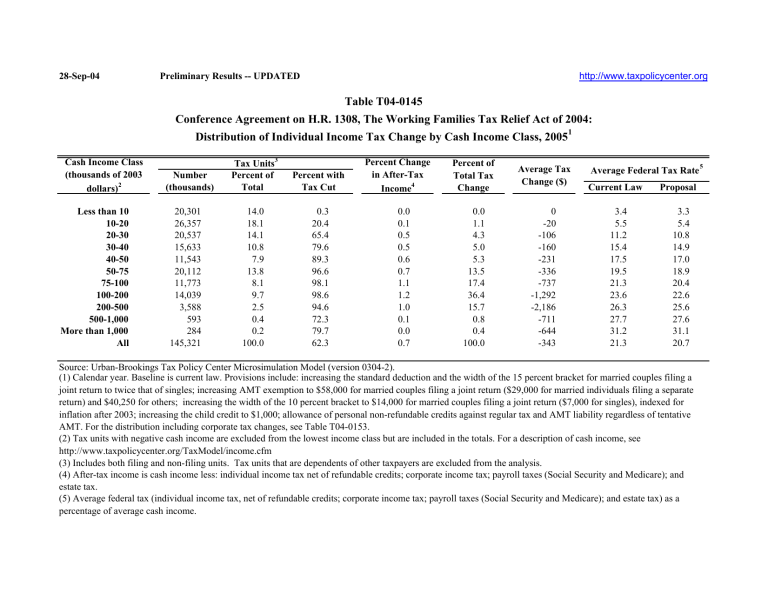
Table T04-0145
28-Sep-04 Preliminary Results -- UPDATED http://www.taxpolicycenter.org
Cash Income Class
(thousands of 2003 dollars)
2
Less than 10
10-20
20-30
30-40
40-50
50-75
75-100
100-200
200-500
500-1,000
More than 1,000
All
Table T04-0145
Conference Agreement on H.R. 1308, The Working Families Tax Relief Act of 2004:
Distribution of Individual Income Tax Change by Cash Income Class, 2005
1
Number
(thousands)
20,301
26,357
20,537
15,633
11,543
20,112
11,773
14,039
3,588
593
284
145,321
Tax Units
3
Percent of
Total
14.0
18.1
14.1
10.8
7.9
13.8
8.1
9.7
2.5
0.4
0.2
100.0
Percent with
Tax Cut
0.3
20.4
65.4
79.6
89.3
96.6
98.1
98.6
94.6
72.3
79.7
62.3
Percent Change in After-Tax
Income
4
0.0
0.1
0.5
0.5
0.6
0.7
1.1
1.2
1.0
0.1
0.0
0.7
Percent of
Total Tax
Change
0.0
1.1
4.3
5.0
5.3
13.5
17.4
36.4
15.7
0.8
0.4
100.0
Average Tax
Change ($)
0
-20
-106
-160
-231
-336
-737
-1,292
-2,186
-711
-644
-343
Average Federal Tax Rate
5
Current Law
3.4
5.5
11.2
15.4
17.5
19.5
21.3
23.6
26.3
27.7
31.2
21.3
Proposal
Source: Urban-Brookings Tax Policy Center Microsimulation Model (version 0304-2).
(1) Calendar year. Baseline is current law. Provisions include: increasing the standard deduction and the width of the 15 percent bracket for married couples filing a joint return to twice that of singles; increasing AMT exemption to $58,000 for married couples filing a joint return ($29,000 for married individuals filing a separate return) and $40,250 for others; increasing the width of the 10 percent bracket to $14,000 for married couples filing a joint return ($7,000 for singles), indexed for inflation after 2003; increasing the child credit to $1,000; allowance of personal non-refundable credits against regular tax and AMT liability regardless of tentative
AMT. For the distribution including corporate tax changes, see Table T04-0153.
(2) Tax units with negative cash income are excluded from the lowest income class but are included in the totals. For a description of cash income, see http://www.taxpolicycenter.org/TaxModel/income.cfm
(3) Includes both filing and non-filing units. Tax units that are dependents of other taxpayers are excluded from the analysis.
(4) After-tax income is cash income less: individual income tax net of refundable credits; corporate income tax; payroll taxes (Social Security and Medicare); and estate tax.
(5) Average federal tax (individual income tax, net of refundable credits; corporate income tax; payroll taxes (Social Security and Medicare); and estate tax) as a percentage of average cash income.
22.6
25.6
27.6
31.1
20.7
3.3
5.4
10.8
14.9
17.0
18.9
20.4
