Document 14147130
advertisement
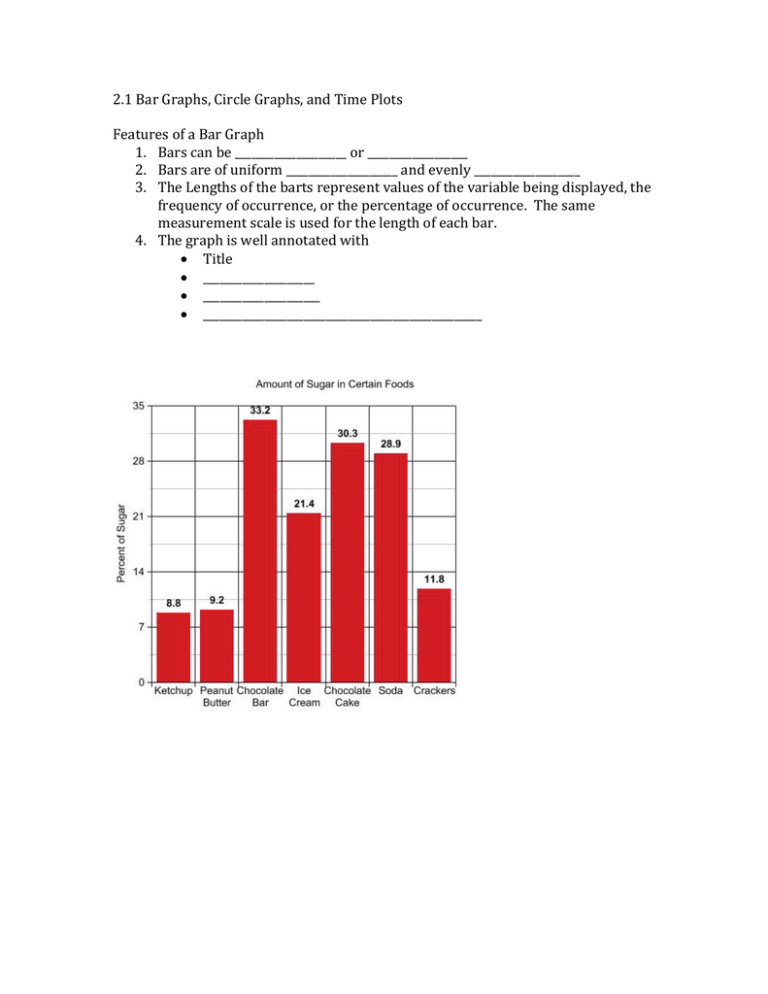
2.1 Bar Graphs, Circle Graphs, and Time Plots Features of a Bar Graph 1. Bars can be ____________________ or __________________ 2. Bars are of uniform ____________________ and evenly ___________________ 3. The Lengths of the barts represent values of the variable being displayed, the frequency of occurrence, or the percentage of occurrence. The same measurement scale is used for the length of each bar. 4. The graph is well annotated with • Title • ____________________ • _____________________ • __________________________________________________ Clustered Bar Graph More than one value is represented together by bars right next to each other Circle Graph Figure out what each “pie piece” is as a percentage of total. Multiply that percentage by 360 to figure the number of degrees it represents in the circle. Time Plot Shows data in chronological order. Time is on the horizontal and the variable goes on the vertical. Pareto Chart Bar graph where each bar represents frequency of an event. Bars are arranged left to right according to decreasing height.

