Proceedings of the Tenth International AAAI Conference on
Web and Social Media (ICWSM 2016)
A Semi-Automatic Method for
Efficient Detection of Stories on Social Media
Soroush Vosoughi, Deb Roy
Massachusetts Institute of Technology
Cambridge, MA 02139
soroush@mit.edu, dkroy@media.mit.edu
could be anything from eye-witness testimony, to false rumors, or reports from the media or law enforcement agencies.
Abstract
Twitter has become one of the main sources of news for
many people. As real-world events and emergencies unfold,
Twitter is abuzz with hundreds of thousands of stories about
the events. Some of these stories are harmless, while others
could potentially be life-saving or sources of malicious rumors. Thus, it is critically important to be able to efficiently
track stories that spread on Twitter during these events. In this
paper, we present a novel semi-automatic tool that enables
users to efficiently identify and track stories about real-world
events on Twitter. We ran a user study with 25 participants,
demonstrating that compared to more conventional methods,
our tool can increase the speed and the accuracy with which
users can track stories about real-world events.
What is an Assertion?
An assertion is an utterance that commits the speaker to the
truth of the expressed proposition. For example, the tweet,
”there is a third bomber on the roof” contains an assertion,
while the tweet, ”I hate reporters!” does not (it contains an
expression). It has been shown than more than half of tweets
about events do not contain assertions (Vosoughi and Roy
2016). Thus, by filtering all non-assertions tweets, we can
drastically reduce the number of tweets that need to be analysed for story detection.
Introduction
System Overview
In recent years, Twitter, a social media platform with hundreds of millions of users, has become a major source of
news for people (Stassen 2010). This is especially true for
breaking-news about real-world events (Kwak et al. 2010).
The 2011 Japanese earthquake, the 2013 Boston marathon
bombings, and the 2015 Paris shootings are just three examples of an event where Twitter played major role in the
dissemination of information. However, given the great volume of tweets generated during these events, it becomes extremely difficult to make sense of all the information that
is being shared. In this paper, we present a semi-automatic
tool that combines state-of-the-art natural language processing and clustering algorithms in a novel way, enabling users
to efficiently and accurately identify and track stories that
spread on Twitter about particular events. The output of our
system can also be used by rumor verification systems to
substantiate the veracity of rumors on Twitter (Vosoughi
2015).
A lot of the messages that are posted on Twitter about
events are not directly related to any stories about the event
itself. For instance, a tweet talking about how scared someone is about an event, does not contain useful information
about the event itself. Tweets that are related to a story usually contain assertions. Therefore, our method focused on
first identifying assertions about events. These assertions
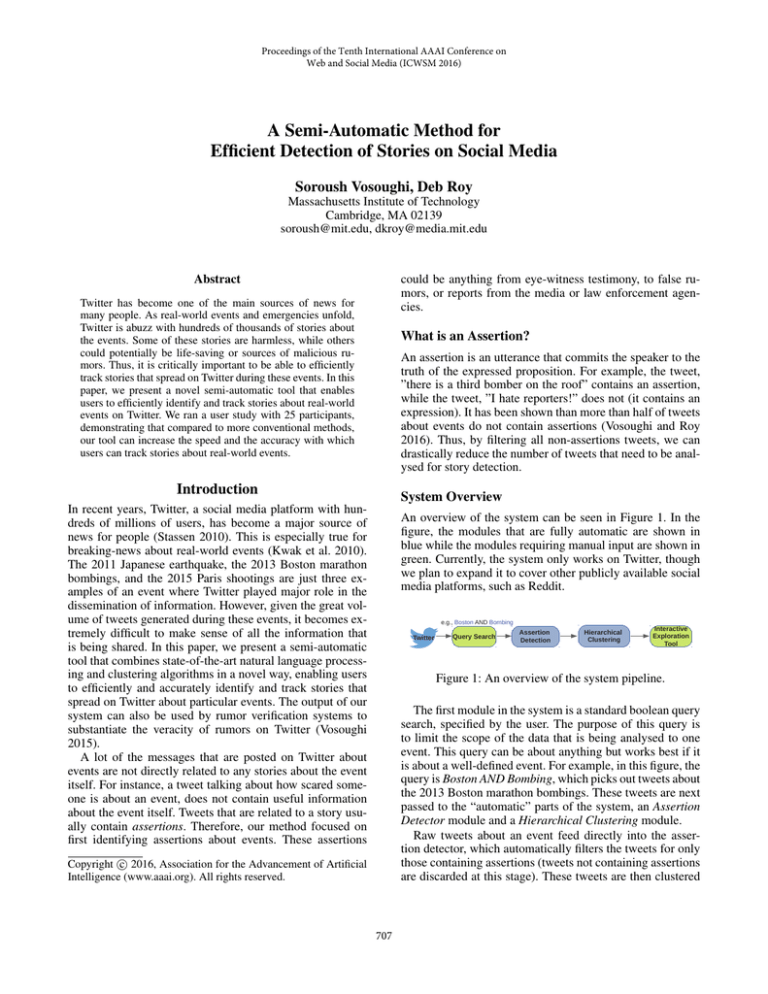
An overview of the system can be seen in Figure 1. In the
figure, the modules that are fully automatic are shown in
blue while the modules requiring manual input are shown in
green. Currently, the system only works on Twitter, though
we plan to expand it to cover other publicly available social
media platforms, such as Reddit.
Figure 1: An overview of the system pipeline.
The first module in the system is a standard boolean query
search, specified by the user. The purpose of this query is
to limit the scope of the data that is being analysed to one
event. This query can be about anything but works best if it
is about a well-defined event. For example, in this figure, the
query is Boston AND Bombing, which picks out tweets about
the 2013 Boston marathon bombings. These tweets are next
passed to the “automatic” parts of the system, an Assertion
Detector module and a Hierarchical Clustering module.
Raw tweets about an event feed directly into the assertion detector, which automatically filters the tweets for only
those containing assertions (tweets not containing assertions
are discarded at this stage). These tweets are then clustered
c 2016, Association for the Advancement of Artificial
Copyright Intelligence (www.aaai.org). All rights reserved.
707
in a hierarchical manner, based on the their semantic similarity. In theory, these clusters should mostly contain tweets
that are making similar assertions. The hierarchical clusters
(and their contents, including the text and the meta-data of
the tweets they contain) are passed to the user-facing, interactive exploration tool. The exploration tool can be used
to identify, investigate, and track stories, that are spreading
about an event on Twitter.
be up to the users to decide how to best cut-off and explore
the clusters. For example, if the event in question is a very
local event, meaning that there are not many tweets about
the event, then perhaps a partition higher in the tree would
be more useful and vice-versa.
Hierarchical clustering of text documents is a well-studied
problem. However, as was the case with speech-act classification, the noisy, unconventional and most importantly short
nature of the language used on Twitter, greatly reduce the
performance of conventional hierarchical document clustering methods. Thus, we developed a novel hierarchical clustering method for Twitter, using very recent advances in
Twitter natural language processing techniques.
In the next sections, we will describe a conventional hierarchical clustering method, followed by our novel method.
Both methods were implemented so that the performance of
our novel method could be benchmarked.
Detecting Assertions in Tweets
Assertions are a class of speech-acts. In order to detect assertions in tweets, a speech-act classifier is needed. We manually annotated 7, 000 tweets about several different realworld events. We labelled these tweets as either containing
assertions or not. Of the 7, 000 tweets, 3, 290 (47%) of those
tweets containing assertions and the rest containing one of
the other speech-acts. These tweets were used to train a
state-of-the-art supervised Twitter speech-act classifier, developed by Vosoughi et al. (Vosoughi and Roy 2016).
Since, we were interested in only detecting assertions, we
turned the speech-act classifier to a binary assertion classifier (by collapsing all the non-assertion classes into one
class). We evaluated the classifier using 20-fold cross validation, with the F-score for classifying assertions being .86.
The performance of this classifier is better illustrated by its
ROC curve in Figure 2.
Conventional Method
Generally speaking, there are two strategies for hierarchical
clustering:
• Agglomerative: This is a ”bottom up” approach; each observation starts in its own cluster, and pairs of clusters are
merged as one moves up the hierarchy.
• Divisive: This is a ”top down” approach; all observations
start in one cluster, and splits are performed recursively as
one moves down the hierarchy.
The complexity of agglomerative clustering is polynomial at O(n3 ), while the complexity of divisive clustering
is exponential at O(2n ). Given the potentially large number
tweets about an event, we decided to use Hierarchical Agglomerative Clustering (HAC), given its lower complexity.
To do any sort of clustering of documents (such as
tweets), a similarity function is needed, to measure the similarity between different documents and decide which clusters to merge or divide. A standard metric used to measure
similarity between text documents is TF-IDF combined with
cosine similarity. TF-IDF is a method of converting text into
numbers so that it can be represented meaningfully by a vector. TF-IDF is the product of two statistics, TF or Term Frequency and IDF or Inverse Document Frequency. Using TFIDF, a vector for each document is derived. The set of documents in our collection is then viewed as a set of vectors in a
vector space with each term having its own axis. Similarity
between two documents is measured using cosine similarity.
With this similarity function, we can hierarchically cluster
tweets using HAC.
Figure 2: The receiver operating characteristic (ROC) curve
of the assertion classifier.
Hierarchical Clustering of Tweets
The next part in the automatic processing pipeline is the hierarchical clustering of semantically similar tweets, in order
to group together tweets making similar assertions. The output of hierarchical clustering can best be described as a dendrogram.At the lowest level of the dendrogram, all tweets
belong to their own clusters. At the very root of the tree is
a single cluster, containing all the tweets. Users can explore
the clusters at any level. A partition lower in the tree (further
from the root) would yield more clusters, with each cluster
containing fewer number of tweets. Conversely, a partition
higher in the tree would yield less clusters, with each containing greater number of tweets. Depending on the event,
there could be thousands of clusters at different levels. It will
Novel Method
TF-IDF, combined with cosine similarity is usually a good
method of measuring similarity between documents. However, tweets are short (140 characters), irregular text whose
topic-level information can be hardly expressed by TF-IDF
representations. An alternative method, is to use a similarity
metric that is adapted to this platform.
708
Twitter Paraphrase Identification We implemented the
Twitter paraphrase identification method proposed recently
by Asli Eyecioglu and Bill Keller (Eyecioglu and Keller
2015) (winners of SemEval-2015 in this category) to measure similarity between pairs of tweets. This method is for
identifying Twitter paraphrase pairs, where paraphrase identification is defined as ”the task of deciding whether two
given text fragments have the same meaning”. This method
takes a pair of tweets and makes a binary judgement on
whether these two tweets are paraphrases. For example, the
tweets, ”Amber alert gave me a damn heart attack” and
”That Amber alert scared the crap out of me” are a paraphrase pair, while the tweets ”My phone is annoying me
with these amber alert”, and ”Am I the only one who dont
get Amber alert” are not a paraphrase pair.
We used a dataset called the Twitter Paraphrase Corpus
(TPC) (Xu et al. 2014) for training and testing our model.
The dataset contains 18K tweet pairs 1K test data, with 35%
those pairs being paraphrases, and 65% non-paraphrases.
We trained an linear SVM classifier using the features proposed in that paper. These features are based on overlap of
word level and character level n-grams. To begin, the text
in each tweet is cleaned and represented as a set of tokens,
where a token can be a character or word unigram or bigram.
The overlap features are then created using set operations:
size of the union of the tokens, size of the intersection of the
tokens, and the size of the set of tokens.
Of all the combinations of overlap features, the following
six features were shown to be the most informative: union
of word unigrams, union of character bigrams, intersection
of word unigrams, intersection of character bigrams, sizes
of tweet 1 and tweet 2. The linear SVM trained on these
features achieved an F-score of .67%. Other than the great
performance, this method is very fitted to our use-case since
both feature extraction and classification are extremely fast.
Given that sometimes the number of tweets about a particular event could be in the millions, this is extremely important.
All possible pairs of tweets that make it past our assertion
detector (which is N2 pairs, N being the number of tweets
containing assertions), are passed through this binary classifier, to be classified as paraphrases or not. The results are
used to create an undirected graph, with each of the N tweets
being represented as a node, and edges between nodes representing paraphrase pairs. This graph is used to construct
hierarchical clusters of tweets.
et al. 2013). It is however the speed of this method which is
its main advantage, as it takes only two minutes to analyze
a typical network of 2 million nodes. This is very important
for applications requiring real-time clustering, such as ours.
Also, crucial for our task, the Louvain method generates hierarchical structures.
The idea behind the method is the greedy optimization of
the modularity of the graph. Modularity is defined as a value
between −1 and 1 that measures the density of links inside
communities compared to the links between communities.
The method consists of two steps. First, the method looks
for ”small” communities by optimizing modularity locally.
Second, it aggregates nodes belonging to the same community and builds a new network whose nodes are the communities. These steps are repeated iteratively until a maximum
of modularity is attained and a hierarchy of communities is
produced (De Meo et al. 2011). These hierarchical communities are analogous to the hierarchical clusters generated by
HAC, in that these communities contain similar assertions.
Experiments
Analysis 1 Since our system is semi-automatic, the evaluation is based on user-centric criteria: the accuracy and the
speed with which users can identify assertions about a particular event on Twitter. To do this, we used snopes.com to
identify several rumors (a rumor is an unverified assertion)
that had spread on Twitter for three different events: the 2013
Boston marathon bombings (10 rumors), the 2011 Japanese
earthquake (6 rumors), and the 2015 Charlie Hebdo shooting
in Paris (5 rumors). We manually collected between 150 to
500 English-language tweets for each rumor. For each event,
we also mixed in several hundred random tweets about the
event, not related to any of the rumors (in order to mimic a
real-world situation where there is a mixture of tweets containing rumors and tweets that do not). In total there were
9,825 tweets across all three events (6,825 about one of the
21 rumors, and 3,000 random tweets about one of the three
events).
We asked a group of twenty five undergraduates to identify the rumors for each of the events. We divided the subjects into five groups. The first group used a version of our
tool that only applied HAC to the data (without any assertion filtering), the second group’s tool applied assertion detection (AD) and HAC to the data (this was an earlier version of our tool (Vosoughi and Roy 2015)), the third group’s
tool applied the Louvain clustering method (without assertion filtering), the fourth group’s tool applied AD and Louvain clustering to the data. The fifth group was the control
group, their tool did not process the data at all, it put all
the tweets (including non-assertions) into one giant cluster.
Note that when using any of the hierarchical clustering algorithms, the users were allowed to explore the fully hierarchy.
The tool did not decide on the number of clusters (i.e. where
to cut the tree).
The subjects did not know beforehand how many rumors,
if any, the dataset contained. Each person worked independently and was allowed five minutes per event. The time
limit was set for two reasons. First, the limit was set in order
to mimic a real-time emergency situation, for which our tool
Clustering using Community Detection Given this undirected graph of tweets, we can use efficient community
detection methods, to detect communities, or ”clusters” of
tweets with similar meaning assertions.
We used a method called the, Louvain (De Meo et al.
2011) for this purpose. The Louvain method is a simple and
efficient method for community detection in very large networks. It uses a greedy optimization method that runs in
time O(n log n), outperforming other community detection
methods in terms of computation time, while performing on
par, if not better, than other methods when it comes to the
accuracy and quality of the extracted communities (Aynaud
709
is designed. Second, given the relatively small size of the
rumor dataset used for this experiment, given enough time,
most subjects would be able to correctly identify all or most
of the rumors using any of the tools, therefore a time-limit
was needed to better differentiate between the different versions of the tool.
After the five minutes had passed, we asked them to list
the rumors they had identified. For each of the five groups,
we averaged the percentage of rumors in our list that they
had correctly identified. Figure 3 shows the mean, and the
standard deviation of each of the five groups. There was a
statistically significant difference between groups as determined by one-way ANOVA (F (4, 20) = 11.283, p < .001).
There are three interesting conclusions that one can draw
from these results. First, the groups using all versions of our
tool outperformed the control group significantly, with the
best performing group outperforming the control group by
76%. Second, Louvain based clustering outperformed HAC,
both when combine with assertion filtering (by 9%) and
when not (by 15%). Second, assertion filtering improved the
performance of both Louvain (by 16%) and HAC clustering (by 21%). The best performing tool was the one that
combined assertion filtering with Louvain based clustering.
Using that tool, the subjects were able to correctly identify
81% of the rumors in five minutes. Though, somewhat simple, this experiment highlights the advantages of our tool,
compared to other more conventional methods.
!"
#$%&
!"
#$%& !&
!&
In this paper, we presented a semi-automatic tool that can be
used to efficiently identify stories about real-world events on
Twitter. This is an important problem since Twitter and other
social media platforms have become one of the main sources
of news for many people. Given a user-specified query about
an event, our tool automatically detects and clusters assertions about that event on Twitter. The system uses a Twitter speech-act classifier, in conjunction with a novel hierarchical clustering method for tweets. Instead of relying on
traditional hierarchical methods which perform poorly on
tweets, our method works by first creating a similarity graph
of tweets (using recent advances in Twitter NLP tools) and
then applying a very fast community detection algorithm on
the graph. The system is not only faster, but it also provides
higher quality clusters (less noisy and more coherent), making it easier for users to quickly sort through thousands of
tweets.
References
Aynaud, T.; Blondel, V. D.; Guillaume, J.-L.; and Lambiotte, R.
2013. Multilevel local optimization of modularity. Graph Partitioning 315–345.
De Meo, P.; Ferrara, E.; Fiumara, G.; and Provetti, A. 2011. Generalized louvain method for community detection in large networks.
In proceedings of ISDA 2011., 88–93.
Eyecioglu, A., and Keller, B. 2015. Asobek: Twitter paraphrase
identification with simple overlap features and svms. In SemEval.
Kwak, H.; Lee, C.; Park, H.; and Moon, S. 2010. What is twitter,
a social network or a news media? In proceedings of WWW 2010.
Rand, W. M. 1971. Objective criteria for the evaluation of clustering methods. Journal of the American Statistical association
66(336):846–850.
Stassen, W. 2010. Your news in 140 characters: exploring the
role of social media in journalism. Global Media Journal-African
Edition 4(1):116–131.
Vinh, N. X.; Epps, J.; and Bailey, J. 2010. Information theoretic
measures for clusterings comparison: Variants, properties, normalization and correction for chance. The Journal of Machine Learning Research 11:2837–2854.
Vosoughi, S., and Roy, D. 2015. A human-machine collaborative
system for identifying rumors on twitter. In proceedings of ICDMW
2015, 47–50.
Vosoughi, S., and Roy, D. 2016. Tweet acts: A speech act classifier
for twitter. In proceedings of the 10th ICWSM.
Vosoughi, S. 2015. Automatic Detection and Verification of Rumors on Twitter. Ph.D. Dissertation, Massachusetts Institute of
Technology.
Xu, W.; Ritter, A.; Callison-Burch, C.; Dolan, W. B.; and Ji,
Y. 2014. Extracting lexically divergent paraphrases from twitter. Transactions of the Association for Computational Linguistics
2:435–448.
Adjusted MI
0.19
0.31
Conclusions
Adjusted RAND
0.14
0.25
Table 1: Adjusted RAND and Mutual Information scores for
HAC and Louvain clustering methods.
HAC
Louvain
Figure 3: Percentage of rumors correctly identified by subjects, using five different version of our tool.
Analysis 2 Next, we quantitatively measured the quality of
the clusters that are produced by HAC and Louvain clustering methods. For this analysis, we used the same dataset as
the first analysis, except we did not mix in random tweets,
thus we had a total of 6,825 tweets about 21 different rumors, across 3 events. We ran HAC and Louvain on the
dataset and cut the generated trees so that there would be
21 clusters (same as the number of rumors). We then used
the adjusted RAND index (Rand 1971) and adjusted mutual
information score (Vinh, Epps, and Bailey 2010)–both measures that score the similarity between two data clusterings–
two compare the 21 ground-truth rumor clusters to the clusters produced by HAC and Louvain. Table 1 shows the results. The results are quantitative confirmation that the Louvain is superior to HAC.
710


