Document 13545612
advertisement
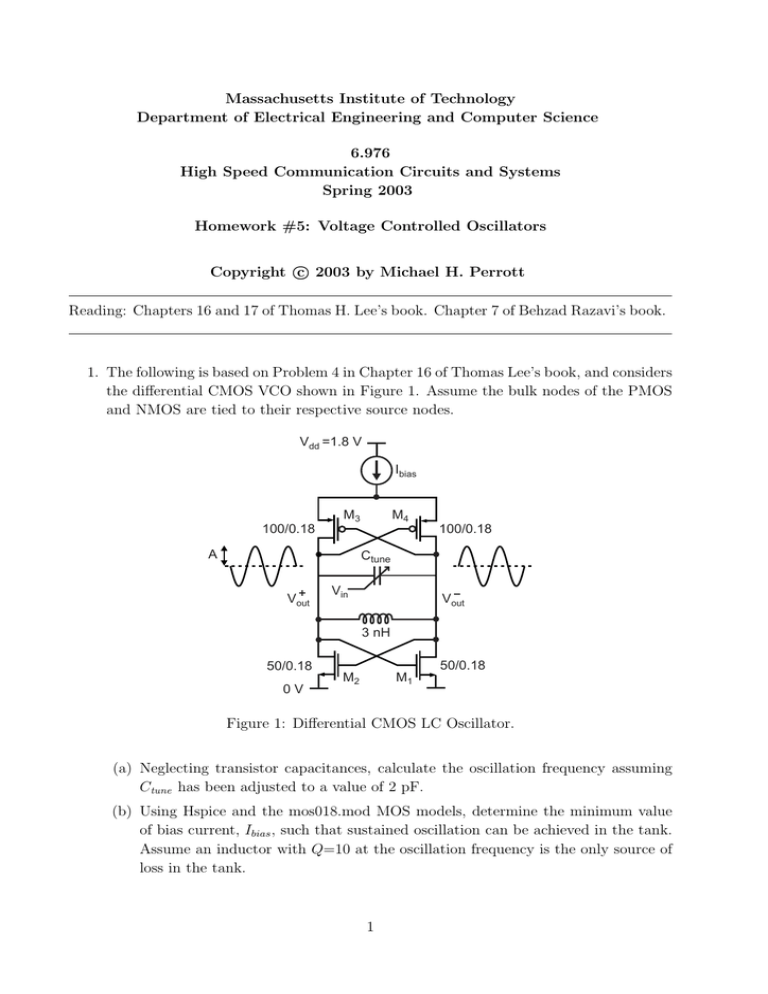
Massachusetts Institute of Technology Department of Electrical Engineering and Computer Science 6.976 High Speed Communication Circuits and Systems Spring 2003 Homework #5: Voltage Controlled Oscillators c 2003 by Michael H. Perrott Copyright � Reading: Chapters 16 and 17 of Thomas H. Lee’s book. Chapter 7 of Behzad Razavi’s book. 1. The following is based on Problem 4 in Chapter 16 of Thomas Lee’s book, and considers the differential CMOS VCO shown in Figure 1. Assume the bulk nodes of the PMOS and NMOS are tied to their respective source nodes. Vdd =1.8 V Ibias 100/0.18 M4 M3 A 100/0.18 Ctune Vout Vin Vout 3 nH 50/0.18 0V M2 M1 50/0.18 Figure 1: Differential CMOS LC Oscillator. (a) Neglecting transistor capacitances, calculate the oscillation frequency assuming Ctune has been adjusted to a value of 2 pF. (b) Using Hspice and the mos018.mod MOS models, determine the minimum value of bias current, Ibias , such that sustained oscillation can be achieved in the tank. Assume an inductor with Q=10 at the oscillation frequency is the only source of loss in the tank. 1 (c) Using minimum Ibias , extract the transistor capacitances and determine the new oscillation frequency. By how much did the frequency shift from that found in part (a)? (d) Calculate the oscillation amplitude, A, as a function of Ibias under the assumption that the current waveforms through the transistors are square waves, and that the oscillator is in the current-limited regime. (e) Assuming that the tank abruptly shifts to the voltage-limited regime when the oscillator amplitude equals half the supply voltage (Vdd ), determine the value of Ibias for which the phase noise of the oscillator will be minimized. (f) Is it possible to use a series tank instead of a parallel tank here? Explain. 2. The following combines Problem 2 and 8 in Chapter 16 and 17, respectively, of Thomas Lee’s book. Here we examine the Colpitts oscillator shown in Figure 2. Use the 0.18u Hspice model file provided on Athena in the file /mit/6.976/Models/0.18u/mos018.mod for your MOS model. Rd=10kΩ Ld=4nH Vout M1 Vbias=1.2V Ibias=100 µA C1=2pF C2=8pF Figure 2: CMOS Colpitts oscillator. (a) Neglecting transistor capacitances and ro , calculate the minimum W/L ratio nec­ essary for a startup gain of 2 under the assumption that the device obeys the square law for its Vgs to Id curve. What should L be set to? Explain. (b) Would there be an advantage to setting the startup gain to a value just slightly higher than 1? If so, why not do so? (c) Given the same conditions as part (a), find the minimum W using Hspice. Use the L value previously selected in (a). (Suggestion: If you encounter problems passing parameters from Cadence to the Spice netlist, consider modifying your Spice netlist (i.e., test.sp) file after running hspc and then running hspice.) (d) Suppose that the tail current source of the oscillator, Ibias is replaced by a 1.3 kΩ resistor and the device size chosen to achieve a startup gain of 2. For simplicity, assume that the transistor can be approximated by its small signal equivalent model, and that the oscillator output amplitude is 0.9 V. 2 i. Model the noise introduced by the 1.3 kΩ resistor as an equivalent noise current source in parallel with the inductor. ii. Ignoring all other noise sources, calculate the phase noise of the oscillator due to this resistor’s noise. What’s the phase noise (dBc/Hz) at 1MHz offset? (Let T =290 K) 3. The following problem focuses on analysis of the linearized oscillator model shown in Figure 3. It is assumed, for simplicity, that both of the current noise sources are white, and that the comparator is ideal (i.e., has infinite slope at its transitions, and no internal noise sources). Negative Resistance Amplifier Vout1 2 inR R C L -1 gm in2 where: 1 gm = R Comparator 1.5 V 2.5 V in2 = 4kT2gm Vout2 Figure 3: Linearized model of an oscillator feeding into a comparator. (a) How does the noise of the tank effective resistance, R, compare to that of the amplifier? Do you think this observation will hold over a wide range of LC oscillators? (b) How does the phase noise of Vout1 compare to the phase noise of Vout2 ? (c) Derive an expression for the phase noise spectrum of Vout1 using Leeson’s ap­ proach. (d) Re-derive the expression for the phase noise spectrum of Vout1 using the LTV (linear, time-varying) analysis method described in Chapter 17 of Thomas Lee’s book. In your calculation, assume that the oscillation waveform and ISF are sinusoidal and that the noise sources are stationary. (e) Compare your answers and provide an explicit expression for F , the Leeson fitting parameter, based on its use in Equation 13 of Chapter 17, for the linearized oscillator model. 3 4. This problem introduces you to spur level calculations and simulation. Consider a VCO with a spurious signal entering at its input as depicted in Figure 4. The voltage, vin , to frequency output, fout , characteristic of the VCO is assumed to be: fout = (Kv vin + fo )Hz, where Kv = 10 MHz/V, fo = 100 MHz. vin(t) out(t) t out(t) = cos(2π (fo+Kvvin(τ))dτ) Figure 4: VCO block and associated equation. (a) Assuming that vin = A sin(2πfspur t), derive an expression for the magnitude (in dBc) of the spurs that result at the output of the VCO. (b) Suppose vin were changed to vin = A sin(2πfspur t) + VB , where VB is a constant bias voltage. Does the value of VB have any effect on the magnitude (in dBc) of the spurs? (c) Does the magnitude (in dBc) of the spurs depend on the value of the VCO output voltage swing? (d) Use CppSim to simulate the system depicted in Figure 4 with vin specified as in part (b), where VB = 0. Set the simulation sample rate to 1 GHz and the number of simulation samples to 10000, and configure the schematic according to the block diagram shown in Figure 5. Measure the spur levels in units of dBc by taking the fft (scaled in dB) of the sine wave output of the VCO and then comparing the spur to the carrier tone. constant out signal_source phase out gain in vco add2 out vin vctrl squareout sineout constant out Figure 5: CppSim block diagram of VCO spur simulation. 4 out Use CppSim and Matlab to plot the resulting spur levels for three different values of A and fo : case (i) case (ii) case (iii) A = 100e-6 fspur = 1 MHz A = 100e-6 fspur = 100 kHz A = 10e-3 fspur = 1 MHz Label the magnitude of the (fundamental) spurs in dBc directly on the plots. (e) Using the equation you derived in part (a), calculate the theoretical spur magni­ tudes (in dBc) for each of the cases in part (d), and check that the answers agree with the results from the simulation. (f) Why do you see harmonics of the spur tones in case (iii)? (g) Given the input levels of noise specified in part (d), how would the spurious noise of the VCO be impacted by increasing the value of Kv ? For the best noise performance, would you choose a high or low value of Kv ? Are there any negative consequences of choosing that (high or low) value of Kv ? (h) Based on this exercise, do you think that it’s easy or hard to design a synthesizer with spurious performance better than -70 dBc? 5


