The Tropical Atmosphere: Hurricane Incubator
advertisement
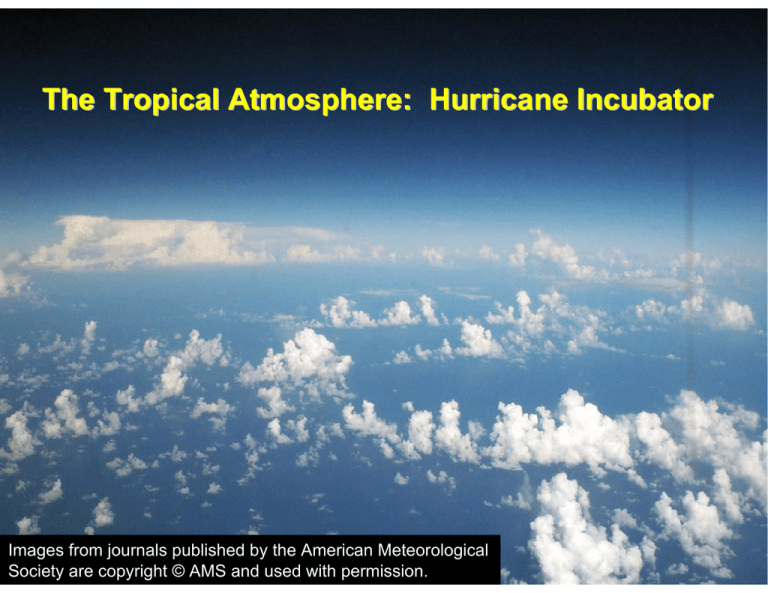
The Tropical Atmosphere: Hurricane Incubator Incubator Images from journals published by the American Meteorological Society are copyright © AMS and used with permission. A One-Dimensional Description Description of the Tropical Atmosphere Atmosphere Elements of Thermal Balance: Solar Radiation • Luminosity: 3.9 x 1026 J s-1 = 6.4 x 10⁷ Wm-2 at top of photosphere • Mean distance from earth: 1.5 x 10¹¹ m • Flux density at mean radius of earth L −2 0 S ≡ = 1370 Wm 0 2 4π d Stefan-Boltzmann Equation: F =σ T 4 −8 −2 −4 σ =5.67×10 Wm K Sun: → 7 4 −2 σ T =6.4×10 Wm T 6,000 K Disposition of Solar Radiation: ⎛ ⎞ 2 Total absorbed solar radiation = S ⎜1− a ⎟ π r 0⎝ p⎠ p a ≡ planetary albedo ( 30% ) p Total surface area = 4π r 2 p S ⎛ ⎞ 0 Absorption per unit area = ⎜1− a p ⎟ 4 ⎝ ⎠ Absorption by clouds, atmosphere, and surface Terrestrial Radiation: Effective emission temperature: S ⎛ ⎞ 4 0 σT ≡ 1− a ⎟ ⎜ e p⎠ 4 ⎝ Earth: T = 255K = − 18°C e Observed average surface temperature = 288 K = 15°C Highly Reduced Model • Transparent to solar radiation • Opaque to infrared radiation • Blackbody emission from surface and each layer Radiative Equilibrium: Top of Atmosphere: S ⎛ ⎞ 4 4 0 1− a ⎟ = σ T σT = ⎜ A p⎠ e 4 ⎝ → TA = Te Surface: S0 4 σ Ts = σ TA + (1− a p ) = 2σ Te 4 4 4 1 → Ts = 2 4 T e = 303 K Surface temperature too large large because: because: • Real atmosphere is not opaque • Heat transported by convection as well as by radiation Extended Layer Models Models TOA : σ T2 4 = σ Te 4 → T2 = Te Middle Layer : 2σ T = σ T2 + σ Ts = σ Te + σ Ts 4 1 4 Surface : σ Ts = σ Te + σ T 4 1 → Ts = 3 4 Te 4 4 1 1 4 T1 = 2 Te 4 4 4 Effects of emissivity<1 Surface : 2ε Aσ TA 4 = ε Aσ T14 + ε Aσ Ts 4 ( 2) → TA = 5 1 4 Te 321K < Ts Stratosphere : 2ε tσ Tt = ε Aσ T2 4 ( 2) → Tt = 1 1 4 Te 214K 4 < Te Full calculation of radiative equilibrium: Problems with radiative radiative equilibrium solution: solution: • Too hot at and near surface • Too cold at a near tropopause • Lapse rate of temperature too large in the troposphere • (But stratosphere temperature close to observed) Missing ingredient: Convection • As important as radiation in transporting enthalpy in the vertical • Also controls distribution of water vapor and clouds, the two most important constituents in radiative transfer When is a fluid unstable to to convection? convection? • Pressure and hydrostatic equilibrium • Buoyancy • Stability Hydrostatic equilibrium: equilibrium: Weight : − g ρδ xδ yδ z Pressure : pδ xδ y − ( p + δ p ) δ xδ y dw F = MA : ρδ xδ yδ z = −g ρδ xδ yδ z − δ pδ xδ y dt dw ∂p α = 1 ρ = specific volume = −g − α , dt ∂z Pressure distribution in atmosphere at rest: RT R* , R≡ Ideal gas : α = p m 1 ∂p ∂ ln( p ) g = =− Hydrostatic : ∂z p ∂z RT Isothermal case : p = p0 e −z H , RT = "scale height " H≡ g Earth: H~ 8 Km Buoyancy: Weight : − g ρbδ xδ yδ z Pressure : pδ xδ y − ( p + δ p ) δ xδ y dw F = MA : ρbδ xδ yδ z = − g ρbδ xδ yδ z − δ pδ xδ y dt dw ∂p ∂p but = − g − αb =−g αe dt ∂z ∂z αb − αe dw → =g ≡B αe dt Buoyancy and Entropy α = 1ρ Specific Volume: Specific Entropy: s α = α ( p, s ⎛ ∂α ⎞ ⎛ ∂T ⎞ Maxwell : ⎜ ⎟ ⎟ =⎜ ⎝ ∂s ⎠ p ⎝ ∂p ⎠ s ⎛ ∂T ⎞ ⎛ ∂α ⎞ =⎜ ⎟⎟ δ s ⎟ δ s = ⎜⎜ ⎝ ∂s ⎠ p ⎝ ∂p ⎠ s B=g (δα ) p (δα ) p g ⎛ ∂T ⎞ α = ⎜⎜ α ⎝ ∂p ⎛ ∂T ⎞ ⎟⎟ δ s = − ⎜ ⎟ δ s ≡ Γδ s ⎝ ∂z ⎠ s ⎠s The adiabatic lapse rate: First Law of Thermodynamics : dsrev dT dα = cv +p Q =T dt dt dt dT d (α p ) dp = cv + −α dt dt dt dT dp = ( cv + R ) −α dt dt dT dp −α = cp dt dt Adiabatic : c p dT − α dp = 0 Hydrostatic : c p dT + gdz = 0 → ( dT dz ) s =− g cp ≡ −Γ d g Γ= c p Earth’s atmosphere: Γ = 1 K 100 m Model Aircraft Measurements (Renno and Williams, 1995) Radiative equilibrium is unstable in the troposphere Re-calculate equilibrium assuming that tropospheric stability is rendered neutral by convection: Radiative-Convective Equilibrium Better, but still too hot at surface, too cold at tropopause Above a thin boundary layer, most atmospheric convection involved phase change of water: Moist Convection Convection Moist Convection Convection • Significant heating owing to phase changes of water • Redistribution of water vapor – most important greenhouse gas • Significant contributor to stratiform cloudiness – albedo and longwave trapping Stability Assessment using Tephigrams: 100 Pressure (mb) 200 300 400 500 600 700 800 900 1000 -40 -30 -20 -10 0 10 Temperature (C) 20 30 40 50 Stability Assessment using Tephigrams: Convective Available Potential Energy (CAPE): CAPEi ≡ ∫ (α p − α e )dp pi pn ( ) = ∫ Rd Tρ − Tρ d ln ( p ) pi p p e Tropical Soundings: Virtually no CAPE CAPE Annual Mean Kapingamoronga Kapingamoronga Tropical Cyclones: Steady State State Physics. Where does the Energy Energy Come From? From? Angular momentum per unit mass M = rV + Ωsin (θ ) r 2 Energy Production Production Carnot Theorem: Maximum efficiency results from from a particular energy cycle: cycle: • • • • Isothermal expansion Adiabatic expansion Isothermal compression Adiabatic compression Note: Last leg is not adiabatic in hurricane: Air cools radiatively. But since environmental temperature profile is moist adiabatic, the amount of radiative cooling is the same as if air were saturated and descending moist adiabatically. Maximum rate of working: Ts − To W= Q T s Total rate of heat input to hurricane: * 3 Q = 2π ∫ ρ ⎡⎣Ck | V | ( k0 − k ) + CD | V | ⎤⎦ rdr 0 r0 Dissipative heating Surface enthalpy flux In steady state, Work is used to balance frictional dissipation: r0 W = 2π ∫ ρ ⎡⎣CD | V | ⎤⎦ rdr 0 3 Plug into Carnot equation: ∫ r0 0 Ts − To ρ ⎡⎣CD | V | ⎤⎦ rdr = To 3 ∫ r0 0 * ⎡ ρ ⎣Ck | V | ( k0 − k ) ⎤⎦ rdr If integrals dominated by values of integrands near radius of maximum winds, ( Ck Ts − To 2 * k0 − k → |Vmax | ≅ C D To ) Graph of Solution for particular values of coefficients: coefficients: 00 GMT 21 March 2008 40oN 20oN o 0 20oS 40oS o 60oE 0 0 10 20 120oE 30 40 180oW 50 120oW 60 70 60oW 80 90 o 0 100 Numerical simulations Relationship between potential potential intensity (PI) and intensity of of real tropical cyclones cyclones Wind speed (m/s) Potential wind speed (m/s) 80 70 60 50 V (m/s) 40 30 20 10 -80 -60 -40 -20 0 20 40 60 Time after maximum intensity (hours) 80 100 Evolution with respect to time of maximum intensity Evolution with respect to time of maximum intensity, normalized by peak wind Evolution curve of Atlantic storms whose lifetime maximum intensity is limited by declining potential intensity, but not by landfall Evolution curve of WPAC storms whose lifetime maximum intensity is limited by declining potential intensity, but not by landfall CDF of normalized lifetime maximum wind speeds of North Atlantic tropical cyclones of tropical storm strength (18 m s−1) or greater, for those storms whose lifetime maximum intensity was limited by landfall. CDF of normalized lifetime maximum wind speeds of Northwest Pacific tropical cyclones of tropical storm strength (18 m s−1) or greater, for those storms whose lifetime maximum intensity was limited by landfall. Evolution of Atlantic storms whose lifetime maximum intensity was limited by landfall Evolution of Pacific storms whose lifetime maximum intensity was limited by landfall Composite evolution of landfalling storms MIT OpenCourseWare http://ocw.mit.edu 12.103 Science and Policy of Natural Hazards Spring 2010 For information about citing these materials or our Terms of Use, visit: http://ocw.mit.edu/terms.
