Document 13310459
advertisement
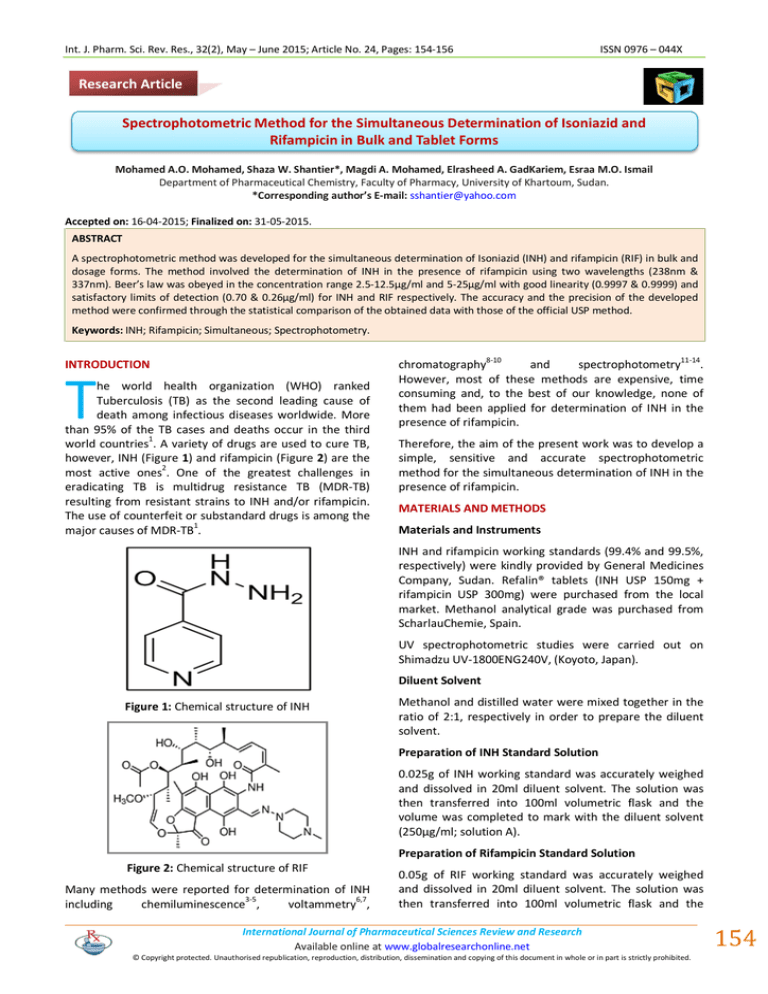
Int. J. Pharm. Sci. Rev. Res., 32(2), May – June 2015; Article No. 24, Pages: 154-156 ISSN 0976 – 044X Research Article Spectrophotometric Method for the Simultaneous Determination of Isoniazid and Rifampicin in Bulk and Tablet Forms Mohamed A.O. Mohamed, Shaza W. Shantier*, Magdi A. Mohamed, Elrasheed A. GadKariem, Esraa M.O. Ismail Department of Pharmaceutical Chemistry, Faculty of Pharmacy, University of Khartoum, Sudan. *Corresponding author’s E-mail: sshantier@yahoo.com Accepted on: 16-04-2015; Finalized on: 31-05-2015. ABSTRACT A spectrophotometric method was developed for the simultaneous determination of Isoniazid (INH) and rifampicin (RIF) in bulk and dosage forms. The method involved the determination of INH in the presence of rifampicin using two wavelengths (238nm & 337nm). Beer’s law was obeyed in the concentration range 2.5-12.5µg/ml and 5-25µg/ml with good linearity (0.9997 & 0.9999) and satisfactory limits of detection (0.70 & 0.26µg/ml) for INH and RIF respectively. The accuracy and the precision of the developed method were confirmed through the statistical comparison of the obtained data with those of the official USP method. Keywords: INH; Rifampicin; Simultaneous; Spectrophotometry. INTRODUCTION T he world health organization (WHO) ranked Tuberculosis (TB) as the second leading cause of death among infectious diseases worldwide. More than 95% of the TB cases and deaths occur in the third world countries1. A variety of drugs are used to cure TB, however, INH (Figure 1) and rifampicin (Figure 2) are the most active ones2. One of the greatest challenges in eradicating TB is multidrug resistance TB (MDR-TB) resulting from resistant strains to INH and/or rifampicin. The use of counterfeit or substandard drugs is among the major causes of MDR-TB1. chromatography8-10 and spectrophotometry11-14. However, most of these methods are expensive, time consuming and, to the best of our knowledge, none of them had been applied for determination of INH in the presence of rifampicin. Therefore, the aim of the present work was to develop a simple, sensitive and accurate spectrophotometric method for the simultaneous determination of INH in the presence of rifampicin. MATERIALS AND METHODS Materials and Instruments INH and rifampicin working standards (99.4% and 99.5%, respectively) were kindly provided by General Medicines Company, Sudan. Refalin® tablets (INH USP 150mg + rifampicin USP 300mg) were purchased from the local market. Methanol analytical grade was purchased from ScharlauChemie, Spain. UV spectrophotometric studies were carried out on Shimadzu UV-1800ENG240V, (Koyoto, Japan). Diluent Solvent Figure 1: Chemical structure of INH Methanol and distilled water were mixed together in the ratio of 2:1, respectively in order to prepare the diluent solvent. Preparation of INH Standard Solution 0.025g of INH working standard was accurately weighed and dissolved in 20ml diluent solvent. The solution was then transferred into 100ml volumetric flask and the volume was completed to mark with the diluent solvent (250µg/ml; solution A). Preparation of Rifampicin Standard Solution Figure 2: Chemical structure of RIF Many methods were reported for determination of INH including chemiluminescence3-5, voltammetry6,7, 0.05g of RIF working standard was accurately weighed and dissolved in 20ml diluent solvent. The solution was then transferred into 100ml volumetric flask and the International Journal of Pharmaceutical Sciences Review and Research Available online at www.globalresearchonline.net © Copyright protected. Unauthorised republication, reproduction, distribution, dissemination and copying of this document in whole or in part is strictly prohibited. 154 © Copyright pro Int. J. Pharm. Sci. Rev. Res., 32(2), May – June 2015; Article No. 24, Pages: 154-156 volume was completed to mark with the diluent solvent (500µg/ml; solution B). Procedures Estimation of Wavelengths One ml of each solution A and B were transferred to separate 100ml volumetric flasks. In a third 100ml volumetric flask 1 ml of solution A was mixed with 1 ml of solution B. The volumes of the above solutions were completed to marks using the diluent solvent. The resultant solutions were scanned between 200-500nm range. The wavelengths were determined and their corresponding specific absorbances were calculated. ISSN 0976 – 044X wavelength 238nm. This was confirmed by mixing fixed amount of rifampicin with increased amounts of INH (Table 1). These findings were used to construct the calibration curve at 238nm. Equation 1 was solved to calculate rifampicin serial concentrations from the absorbance values at 337nm. These concentrations were then substituted in equation 2 to calculate the absorbance values of INH at 238nm. The simultaneous results using wavelengths 238nm and 447nm were found to be less sensitive and less accurate, that is why the determination of INH and RIF was obtained from results at 238nm and 337nm. Calibration Curve A =A1%1cml Cy …………… Eq. 1 (at 337nm) Aliquot volumes from solution A (1-5ml) were transferred into five separate 100ml volumetric flasks. Serial volumes of solution B (1-5ml) were then added to the above solutions to obtain mixtures having concentration in the ratio of 1:2 (INH: RIF). The volumes were then completed to mark using the diluent solvent. Absorbance values were measured at 238nm, 337nm and 477nm. The absorbance values obtained at 238nm were plotted against the corresponding INH and RIF concentrations. Assay of INH in INH/Rifampicin Combined Tablets An amount of the powdered tablets containing 0.025g INH was accurately weighed and dissolved in 20ml of the diluent solvent. The volume was completed to 100ml, mixed and filtered. One ml of the filtrate was diluted to 100ml and the absorbance of the resultant solution was measured at 238nm. The content percent was calculated by direct sample/standard comparison. RESULTS AND DISCUSSION Am = (A1%1cm)xl Cx + (A1%1cm)yl Cy ………. Eq. 2 (at 238nm) 1% Where: Am is the absorbance of the mixture; A 1cm is the specific absorbances for INH and RIF at 238nm; l is the cell path length; CX and CY are the concentrations of INH and RIF, respectively. The results obtained for the absorbance values at 238nm and 337nm are summarized in Table 2. Table 2: Construction of calibration curve (n=3) Conc. µg/ml (INH+RIF) Am RIF Abs. at 337nm RIF Abs. at 238nm INH Abs. at 238nm 2.5+5 0.276 0.163 0.201 0.075 5+10 0.555 0.327 0.404 0.151 7.5+15 0.817 0.488 0.603 0.214 10+20 1.094 0.650 0.803 0.291 12.5+25 1.373 0.816 1.008 0.365 0.9999 0.9999 0.9997 R Table 1: Estimation of Interference Wavelength RIF Volume INH Volume Abs. at 238nm Abs. at 337nm Abs. at 477nm 1 ml 1 ml 0.339 0.170 0.096 1 ml 2 ml 0.459 0.169 0.095 1 ml 3 ml 0.582 0.169 0.094 1 ml 4 ml 0.715 0.172 0.096 1 ml 5 ml 0.835 0.172 0.095 The analysis of two or more components in a sample mixture is straightforward if there are regions in the sample’s spectrum in which each component is the only absorbing species. Unfortunately, UV/Vis absorption bands are so broad making it impossible to find appropriate wavelengths at which each component of a mixture absorbs separately15. The UV spectrum of rifampicin showed absorbance at three wavelengths, namely 238nm, 337nm and 477nm with corresponding specific absorbance values 420.67, 340.66 and 196.00, respectively. INH was found to interfere with rifampicin absorption only at the Analytical Data Beer’s law was obeyed in the concentration range 2.512.5µg/ml and 5-25µg/ml for INH and rifampicin, respectively. Table 3 revealed the optical characteristics and statistical data for the regression equation of the proposed method. The limits of detection (LOD) and quantification (LOQ) were calculated using the standard deviation of response and the slope of the calibration 16 curve . Table 3: Optical characteristics for INH and rifampicin by the proposed method at 238nm Parameter Range Proposed method INH Rifampicin 2.5-12.5µg/ml 5-25 -3 -4 Slope ± tSb* 0.029 ± (2.70x10 ) 0.04 ± (7.0x10 ) Intercept ± tSa* 0.0015 ± 0.029 -0.000048 ± 0.015 Correlation coefficient 0.9997 0.9999 Limit of detection (LOD) 0.70µg/ml 0.26µg/ml Limit of quantification (LOQ) 2.33µg/ml 0.86µg/ml *= 95% confidence limit of the standard error of slope and intercept International Journal of Pharmaceutical Sciences Review and Research Available online at www.globalresearchonline.net © Copyright protected. Unauthorised republication, reproduction, distribution, dissemination and copying of this document in whole or in part is strictly prohibited. 155 © Copyright pro Int. J. Pharm. Sci. Rev. Res., 32(2), May – June 2015; Article No. 24, Pages: 154-156 The precision of the developed method was evaluated by the results obtained from between-days (reproducibility) and within-day data (repeatability) for three concentrations within the linearity range. The calculated RSD values for both drugs were found to be within the accepted limit (less than 2%, Table 4). Table 4: Precision of the proposed method (n=3) Repeatability (RSD %) 1.80 1.70 2.00 1.0 0.7 0.8 Rifampicin 0.25 0.70 0.76 1.4 1.7 1.0 Finally, the proposed method was applied for the determination of INH and RIF in the tablet dosage form. The mean content percent of three independent analyses for INH and rifampicin were found to be102.0 ± 1.25% and 100.3 ± 0.46%, respectively; n=3 (Table 5). Table 5: Validation results of the proposed method compared to the official method Content% ± SD% *t cal, t(tab) *Fcal, F(tab) Proposed Method INH 102.0 ± 1.25 2.76 (2.78) 5.17 (19) Rifampicin 100.3 ± 0.46 1.76 (2.78) 3.58 (19) Official Method INH 99.6 ± 0.55 Rifampicin 101.3 ± 0.87 - - * = t and F calculated and tabulated values The validity of the method was assessed by comparing the statistical results obtained with those of the official USP liquid chromatography method. As the calculated tand F-values were less than tabulated ones, the result of the developed method can be considered as accurate and precise as the liquid chromatographic method. CONCLUSION The proposed method was proved to be simple, selective, precise and sensitive for the determination of INH and rifampicin in bulk form and tablet forms. Statistical and analytical validation of the results, using λ = 238 & 337nm, confirmed that the simultaneous determination could be used as an alternative method for the routine analysis of both drugs in quality control laboratories. REFERENCES 1. 2. 3. dichloroisocyanurate-and trichloroisocyanuric acid-luminol chemiluminescence systems. Il Farmaco. 59, 2004, 481486. 4. Haghighi B, Bozorgzadeh S. Flow injection chemiluminescence determination of isoniazid using luminol and silver nanoparticles. Microchemical journal. 95, 2010, 192-197. 5. Du J, Lu J. Flow injection chemiluminescence determination of isoniazid using the lucigenin–periodate system. Luminescence. 21, 2006, 26-30. 6. Xia HY, Hu XY. Determination of isoniazid using a gold electrode by differential pulse voltammetry. Analytical Letters. 38, 2005,1405-1414. 7. Szlósarczyk M, Piech R, Bator BP, Maślanka A, Opoka W, Krzek J. Voltammetric determination of isoniazid using cyclic renewable mercury film silver based electrode. Pharmaceutica Analytica Acta. 3, 2012, 5. 8. Khuhawar M, Rind F, Rajper A. High-performance liquid chromatographic determination of isoniazid, pyrazinamide, and indomethacin in pharmaceutical preparations. Acta chromatographica. 15, 2005, 269-275. 9. Khuhawar MY, Zardari LA. Ethyl chloroformate as a derivatizing reagent for the gas chromatographic determination of isoniazid and hydrazine in pharmaceutical preparations. Analytical sciences. 24, 2008, 1493-1496. Reproducibility (RSD %) INH Tuberculosis, Fact Sheet No. 104. [Internet]: WHO; [updated October 2014; cited 2014 December, 13]; Available from: http://www.who.int/mediacentre/factsheets/fs104/en/ind ex.html. Katzung BG, Masters SB, Trevor AJ. Basic and Clinical Pharmacology. 12th ed. USA: McGraw-Hill Lange; 2012, 839. Safavi A, Karimi M, Hormozi Nezhad M. Flow-injection determination of isoniazid using sodium ISSN 0976 – 044X 10. Khuhawar M, Rind F. High performance liquid chromatographic determination of isoniazid, pyrazinamide and rifampicin in pharmaceutical preparations. Pakistan journal of pharmaceutical sciences. 18, 1998, 49-54. 11. Oga EF. Spectrophotometric determination of isoniazid in pure and pharmaceuticla formulations using vainillin. International Journal of Pharmacy and Pharmaceutical Sciences. 2, 2010, 55-58. 12. Elhagi AM, Ben Naji NR, Bensaber SM, Almog TK. Microwave assistant technique in spectrophotometric assay of isoniazid using it’s Schiff’s base derivatives. International Journal of pharmaceutical sciences and research. 4, 2013, 644-649. 13. Naidu KG, Suvardhan K, Kumar SK, Rekha D, Sastry BS, Chiranjeevi P. Simple sensitive spectrophotometric determination of isoniazid and ritodrine hydrochloride. Journal of Analytical Chemistry. 60, 2005, 822-827. 14. Nagaraja P, Srinivasa Murthy K, Yathirajan H. Spectrophotometric determination of isoniazid with sodium 1, 2-naphthoquinone-4-sulphonate and cetyltrimethyl ammonium bromide. Talanta. 43, 1996, 1075-1080. 15. David Harvey. Modern Analytical Chemistry, McGraw Hill. 2000, 400. 16. JC Miller and JN Miller. Statistics and Chemometrics for Analytical Chemistry (fifth ed.) Pearson Education Limited, UK. 2005, 39–51, 25. Source of Support: The authors declare no conflict of interest and the current work was self sponsored, Conflict of Interest: None. International Journal of Pharmaceutical Sciences Review and Research Available online at www.globalresearchonline.net © Copyright protected. Unauthorised republication, reproduction, distribution, dissemination and copying of this document in whole or in part is strictly prohibited. 156 © Copyright pro
