Appendix B 2011/12 Updated Revised
Appendix B
2011/12
Updated
Budget
£
RESOURCES SERVICE AREA
R112A Health
Gross Direct Costs 5,092
Gross Direct Income
Support Service Charges
R112A Net Expenditure
0
15,530
20,622
2011/12
Revised
Budget
£
0
0
8,720
8,720
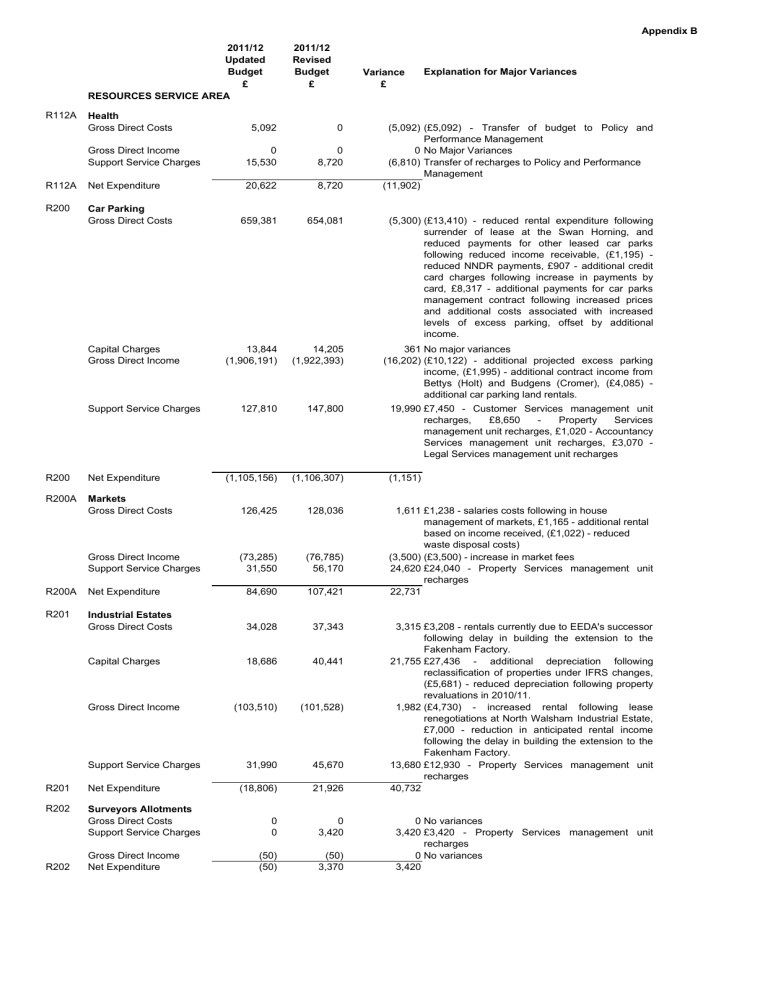
R200 Car Parking
Gross Direct Costs 659,381 654,081
Variance
£
Explanation for Major Variances
(5,092) (£5,092) - Transfer of budget to Policy and
Performance Management
0 No Major Variances
(6,810) Transfer of recharges to Policy and Performance
(11,902)
Management
Capital Charges
Gross Direct Income
Support Service Charges
13,844
(1,906,191)
127,810
(1,105,156)
14,205
(1,922,393)
147,800
(1,106,307)
(5,300) (£13,410) - reduced rental expenditure following surrender of lease at the Swan Horning, and reduced payments for other leased car parks following reduced income receivable, (£1,195) reduced NNDR payments, £907 - additional credit card charges following increase in payments by card, £8,317 - additional payments for car parks management contract following increased prices and additional costs associated with increased levels of excess parking, offset by additional income.
361 No major variances
(16,202) (£10,122) - additional projected excess parking income, (£1,995) - additional contract income from
Bettys (Holt) and Budgens (Cromer), (£4,085) additional car parking land rentals.
19,990 £7,450 - Customer Services management unit recharges, £8,650 Property Services management unit recharges, £1,020 - Accountancy
Services management unit recharges, £3,070 -
Legal Services management unit recharges
(1,151) R200 Net Expenditure
R200A Markets
Gross Direct Costs 126,425 128,036
Gross Direct Income
Support Service Charges
R200A Net Expenditure
R201 Industrial Estates
Gross Direct Costs
(73,285)
31,550
84,690
34,028
(76,785)
56,170
107,421
37,343
1,611 £1,238 - salaries costs following in house management of markets, £1,165 - additional rental based on income received, (£1,022) - reduced waste disposal costs)
(3,500) (£3,500) - increase in market fees
24,620 £24,040 - Property Services management unit recharges
22,731
Capital Charges
Gross Direct Income
18,686
(103,510)
31,990
(18,806)
40,441
(101,528)
45,670
21,926
3,315 £3,208 - rentals currently due to EEDA's successor following delay in building the extension to the
Fakenham Factory.
21,755 £27,436 additional depreciation following reclassification of properties under IFRS changes,
(£5,681) - reduced depreciation following property revaluations in 2010/11.
1,982 (£4,730) increased rental following lease renegotiations at North Walsham Industrial Estate,
£7,000 - reduction in anticipated rental income following the delay in building the extension to the
Fakenham Factory.
13,680 £12,930 - Property Services management unit recharges
40,732 R201
R202
R202
Support Service Charges
Net Expenditure
Surveyors Allotments
Gross Direct Costs
Support Service Charges
Gross Direct Income
Net Expenditure
0
0
(50)
(50)
0
3,420
(50)
3,370
0 No variances
3,420 £3,420 - Property Services management unit recharges
0 No variances
3,420
R203 Handyman
2011/12
Updated
Budget
£
2011/12
Revised
Budget
£
Variance
£
Explanation for Major Variances
Appendix B
Appendix B
R219
R219
R251
R251
R260
IAS 19 Adjustment
Net Expenditure
(251,277)
0
Benefits & Revenues Management
Gross Direct Costs
Gross Direct Income
Support Service Charges
71,981
0
(71,981)
Net Expenditure 0
Personnel & Payroll Support
Gross Direct Costs 342,862
R260
R262
Non Distributed Costs
Gross Direct Costs
Gross Direct Income
Support Service Charges
Net Expenditure
2011/12
Updated
Budget
£
251,277
2011/12
Revised
Budget
£
269,260
(269,260)
0
Variance
£
Explanation for Major Variances
17,983 £12,347 - Actuarial strain costs funded from an earmarked reserve. £5,565 - Inflation on Added
Years costs.
(17,983)
0
0
(342,862)
0
Administration Buildings Service
Gross Direct Costs 501,220
72,744
0
(72,744)
0
360,203
0
(360,203)
0
528,267
763 No Major Variances
0
(763) No Major Variances
0
17,341 £5,681 - Salaries and on costs. £10,000 -
Professional Fees re external employment advice, which is to be funded by an earmarked reserve.
0 No Major Variances
(17,341) Increased recharges reflecting higher direct costs.
0
27,047 (£3,422) - reduction in Caretakers salary costs,
(£5,931) - reduced NNDR costs for Cromer
Offices, £8,125 - professional fees and charges for
Office condition survey to be funded from Asset
Management Reserve, £4,980 - NNDR for Upper
Sheringham Depot not disposed of in 2010/11,
£3,887 - additional NNDR following Fakenham
Connect revaluation, £12,425 - contract cleaning costs for Fakenham Connect and North Walsham
Offices following their removal from the Kier contract, £4,960 - Windmill Restaurant staff costs following backdated regrading, £2,200 - Restaurant purchases, offset by income.
Capital Charges
Gross Direct Income
Support Service Charges
87,424
(72,752)
(477,551)
38,341
81,528
(81,702)
(428,967)
99,126
(5,896) (£5,896) - reduction in depreciation following adjustments to the life expectancy of Admin
Buildings.
(8,950) (£5,208) - 5 months rental from North Norfolk
Health Teams occupation of Cromer offices, £831 - reduction in rental income following Adult
Educations vacation of Fakenham Connect offices,
(£2,373) - recoverable NNDR and service charges for North Walsham Offices, (£2,200) - restaurant sales offset in part by additional costs.
48,584 £2,920 - Computer Network and PC recharges,
(£1,820) - Admin Buildings recharge, £21,220 -
Property Services recharge, £2,830 - Central Costs recharge, £24,600 - Reduction in recharges to other final services from Admin Buildings cost centres.
60,785 R262 Net Expenditure
R262A Property Services
Gross Direct Costs 378,324 414,841
R262A
Capital Charges
Gross Direct Income
Support Service Charges
Net Expenditure
0
(41,500)
(331,569)
5,255
0
(40,690)
(374,151)
0
36,517 £3,544 - staff turnover savings not achieved,
£22,120 - additional staffing costs funded from
Asset Management Reserve, £963 - essential car user allowance for Markets staff, £9,500 -
Leadership of Place (LOP) repairs and maintenance to North Walsham offices funded from carry forward of LOP grant.
0 No variances
810 No major variances
(42,582) £8,100 - Computer Network recharges, £7,900 -
Central Cost recharges, £11,830 Legal Service
Recharges, (£70,820) - Additional recharges to other final services from Property Services
(5,255)
Appendix B
2011/12
Updated
Budget
£
2011/12
Revised
Budget
£
R263 Corporate Finance
Gross Direct Costs
Gross Direct Income
Support Service Charges
R263B Net Expenditure
R263C Internal Audit
Gross Direct Costs
Support Service Charges
R263C Net Expenditure
R263D Policy & Performance
Mgmt
Gross Direct Costs
618,197
Capital Charges
Gross Direct Income
Support Service Charges
Net Expenditure
2,170
0
(620,367)
0 R263
R263B Insurance & Risk Management
Gross Direct Costs 248,109
2,435
0
(604,247)
0
279,150
(650)
(264,126)
(16,667)
(650)
(278,500)
0
111,467
(111,467)
0
601,812
111,467
(111,467)
0
115,099 161,015
(54,430)
60,669
(161,015)
0
Support Service Charges
R263D Net Expenditure
R301 Foreshore
Gross Direct Costs
Capital Charges
Gross Direct Income
Support Service Charges
99,600
7,996
0
64,080
128,376
7,354
0
43,140
171,676 178,870
Variance
£
Explanation for Major Variances
(16,385) (£9,770) Post Transferred to Council Tax . (£3,469)
Adjustment to IAS19 pension costs. (£2,578)
265
0
16,667
0
Savings on Bank Charges.
0
16,120 Lower direct costs to recharge to services.
31,041 (£5,158) - Savings in salaries and on costs.
£36,567 - Reorganisations costs, funded by an earmarked reserve.
0 No Major Variances
(14,374) Increased recharges reflecting higher direct costs.
0 No Major Variances.
0 No Major Variances
45,916 £49,645 - Transfer of budgets to Policy and
7,194
Performance Management as a result of restructuring.
(106,585) Increased recharges reflecting higher direct costs.
(60,669)
28,776 £34,000 - transfer from Foreshore (Community) for
Handrails, following staff restructuring, (£5,149) - staff vacancy in Foreshore Officers.
(642) No major variances
0 No variances
(20,940) (£24,110) - Property Services recharges, £1,210 -
Central Costs recharges, £4,950 Coastal
Protection recharges, (£4,580) - Internal Audit recharges
R301
R302
R302
R318
Net Expenditure
Community Centres
Gross Direct Costs
Capital Charges
Gross Direct Income
Support Service Charges
Net Expenditure
Investment Properties
Gross Direct Costs
Capital Charges
R318
Gross Direct Income
Support Service Charges
Net Expenditure
6,190
0
(2,000)
30,470
34,660
104,800
2,900
(208,887)
100,850
(337)
6,190
27
(2,000)
3,730
7,947
104,207
24,569
(204,749)
67,550
(8,423)
0 No major variances
27 No major variances
0 No variances
(26,740) (£26,680) - Property Services management unit
(26,713) recharges
(593) No major variances
21,669 £3,469 - depreciation associated with the prior year purchase of additional beach huts, £18,200 - additional depreciation following the reclassification of properties from Investment Properties, under
IFRS.
4,138 £6,717 - loss of rental income following transfer of
Sackhouse and Maltings to the Wells Maltings
Trust, (£1,829) - additional rental and service charge income from Other Lettings
(33,300) £1,200 - Computer Network recharges, (£35,400) -
Property Services recharges
(8,086)
R340 Coast Protection
Gross Direct Costs
Capital Charges
Gross Direct Income
Support Service Charges
R340
R341
Net Expenditure
Pathfinder
Gross Direct Costs
Gross Direct Income
Support Service Charges
2011/12
Updated
Budget
£
379,657
468,477
(25)
239,880
1,087,989
2011/12
Revised
Budget
£
429,583
466,135
(8,525)
139,900
1,027,093
Variance
£
Explanation for Major Variances
49,926 £8,500 Additional rock at Happisburgh. £41,426
Roll forward of 2010/11 under spend on sea defence works.
(2,342)
(8,500) (£8,500) Contribution from Coastal Concern towards addition rock at Happisburgh
(99,980) £15,470 Additional recharge from Property
Services. (£116,090) Reduced charge from
Coastal Management reflecting establishment changes and increased work undertaken on
Pathfinder projects.
(60,896)
Appendix B
0
0
46,530
575,153
0
176,030
751,183
575,153 £575,153 Roll forward of 2010/11 under spend
0
129,500 £140,720 Contract extensions for Pathfinder staff
704,653 grant.
plus additional work undertaken by staff in Coastal
Management. (£11,220) Reduction in charges from other support services.
R341
R410
Net Expenditure 46,530
Coast & Community Partnership
Gross Direct Costs 288,075 300,282
Gross Direct Income
R410
R413
Support Service Charges
Net Expenditure
Community Safety
Gross Direct Costs
Gross Direct Income
Support Service Charges
(109,603)
106,300
284,772
56,123
(10,346)
25,630
71,407
(117,568)
127,010
309,724
81,936
(10,346)
7,370
78,960
12,207
(£10,939) - Savings in North Norfolk Community
Partnership (NNCP) running costs. £40,967 -
Reorganisations costs, funded by an earmarked reserve. (£43,983) - Transfer of budgets to Policy and Performance Management as a result of restructuring. £28,000 - Expenditure incurred in relation to Holt Vision Study.
(7,965) (£28,000) - Grant income from NNCP and Holt
Town Council relating to Holt Vision Study.
£20,035 - Contributions towards NNCP costs no longer being received.
20,710 £26,560 - Recharge from Property Services.
24,952
25,813 £25,690 - Reorganisation costs, funded by an
(18,260) This consists of various recharges, e.g.
Insurances, Personnel, Computers and Central
Costs that are recharged based on where staff costs are allocated.
7,553 earmarked reserve.
0 No Major Variances
R413
R414
R414
R450
Net Expenditure
CCTV
Gross Direct Costs
Capital Charges
Gross Direct Income
Support Service Charges
Net Expenditure
Central Costs
Gross Direct Costs
196,747
21,072
(22,696)
20,370
215,493
188,470
197,300
25,479
(22,696)
56,190
256,273
187,542
553 No Major Variances.
4,407
0 No Major Variances.
35,820 £31,180 - Recharge from Property Services.
40,780
R450
Support Service Charges
Net Expenditure
(188,470)
0
R450A Corporate & Democratic Core
Gross Direct Costs 353,631
(187,542)
0
353,585
(928) £2,317 - Salaries and on costs.
(£3,250) -
Professional fees payable to Norfolk Pension Fund for various actuarial reports.
928 No Major Variances.
0
R450A
Capital Charges
Support Service Charges
Net Expenditure
0
842,110
1,195,741
0
860,440
1,214,025
(46) £4,285 - Salaries and on costs. (£4,426) - Local
Government Association subscription costs lower than expected
0
18,330 £19,100 - Recharge from Corporate Leadership
Team.
18,284
Appendix B
2011/12
Updated
Budget
£
R460A Corporate Leadership Team
Gross Direct Costs
Gross Direct Income
Support Service Charges
742,799
(335)
(742,464)
0 R460A Net Expenditure
R472 Coastal Management
Gross Direct Costs 188,678
2011/12
Revised
Budget
£
748,642
0
(748,642)
0
187,455
Gross Direct Income
Support Service Charges
(26,780)
(193,591)
(31,693)
(20,420)
(167,035)
0
Variance
£
Explanation for Major Variances
5,843 £5,325 Turnover savings not made.
335
(6,178) Increased direct costs recharged out to services.
0
(1,223) (£15,339) Coastal Technician appointed on lower grade.
£25,619 Contract extensions for staff engaged on Pathfinder.
(£4,401) Coastal
Engineer appointed later in the year. (£3,320)
Lease car rental no longer required. (£3,055)
Pension deficit funding.
6,360 (£6,360) Reduced recharges to Pathfinder capital projects.
26,556 £53,780 Increased charges in from Property
Services & £13,210. (£140,720) Increased recharges out to Pathfinder, (£14,100) Cromer Pier
& (£4,950) Promenade Mgt. £116,090 Reduced recharges out to Coast Protection & £3,250
Democratic Representation.
31,693 R472 Net Expenditure
Total
Gross Direct Costs
IAS 19 Adjustment
Capital Charges
Gross Direct Income
Support Service Charges
Net Expenditure
40,349,817 43,006,880
(251,277)
665,978
(36,547,433) (38,365,090)
(538,428)
3,678,657
(269,260)
701,116
(488,633)
4,585,013
2,657,063
(17,983)
35,138
(1,817,657)
49,795
906,356
