Supporting Communities Service Area Appendix B
advertisement
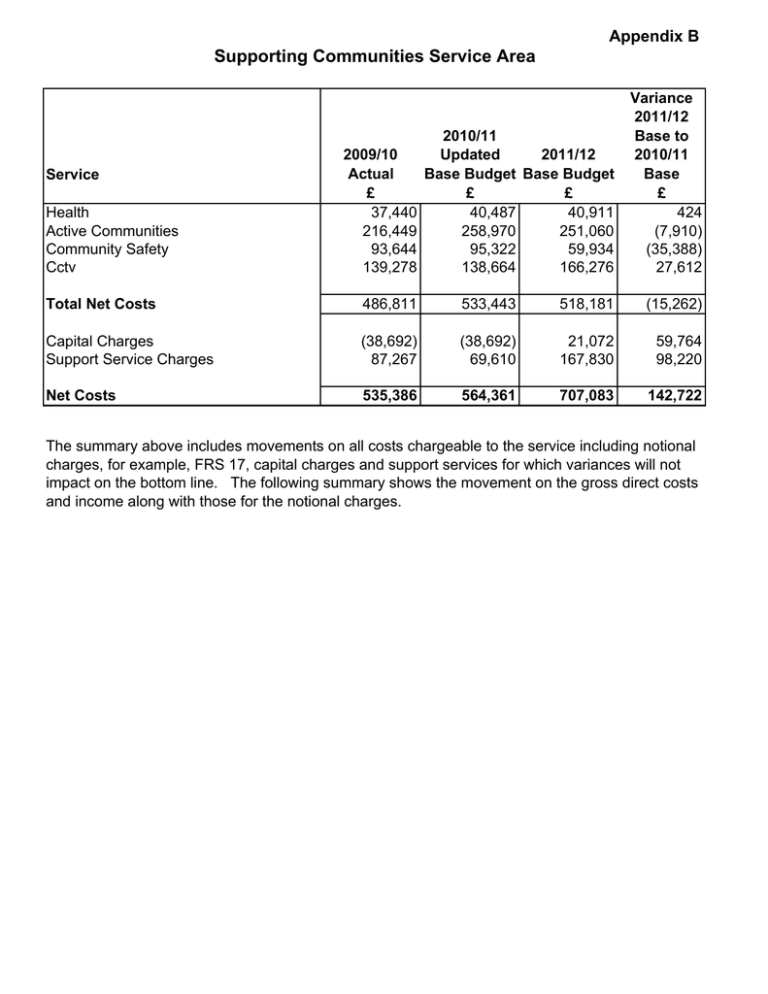
Appendix B Supporting Communities Service Area Service Health Active Communities Community Safety Cctv 2010/11 2009/10 Updated 2011/12 Actual Base Budget Base Budget £ £ £ 37,440 40,487 40,911 216,449 258,970 251,060 93,644 95,322 59,934 139,278 138,664 166,276 Variance 2011/12 Base to 2010/11 Base £ 424 (7,910) (35,388) 27,612 Total Net Costs 486,811 533,443 518,181 (15,262) Capital Charges Support Service Charges (38,692) 87,267 (38,692) 69,610 21,072 167,830 59,764 98,220 Net Costs 535,386 564,361 707,083 142,722 The summary above includes movements on all costs chargeable to the service including notional charges, for example, FRS 17, capital charges and support services for which variances will not impact on the bottom line. The following summary shows the movement on the gross direct costs and income along with those for the notional charges. Appendix B 2010/11 Updated Budget £ 2011/12 Base Budget £ Explanation for Major Variances Variance £ SUPPORTING COMMUNITIES SERVICE AREA Health Gross Direct Costs Gross Direct Income Support Service Charges Net Expenditure 40,487 0 3,350 43,837 40,911 0 15,530 56,441 366,418 360,663 (107,448) 46,190 (109,603) 106,300 Net Expenditure 305,160 357,360 Community Safety Gross Direct Costs 110,322 70,280 (40,042) (£24,654) - Fixed term contracts ceasing June 2011. (£15,455) - Equipment budget transferred to CCTV service. Gross Direct Income (15,000) (10,346) 4,654 £4,654 - Grant funding ceasing for fixed term contract staff. 14,210 25,630 Net Expenditure 109,532 85,564 CCTV Gross Direct Costs 168,664 188,972 Capital Charges (38,692) 21,072 Gross Direct Income (30,000) (22,696) Support Service Charges Net Expenditure 5,860 105,832 20,370 207,718 Gross Direct Costs FRS 17 Adjustment Capital Charges Gross Direct Income Support Service Charges Net Expenditure 685,891 0 (38,692) (152,448) 69,610 564,361 660,826 0 21,072 (142,645) 167,830 707,083 Active Communities Gross Direct Costs Gross Direct Income Support Service Charges Support Service Charges 424 No Major Variances 0 No Major Variances 12,180 £8,030 - Corporate Leadership Team. 12,604 (5,755) £4,740 - Pay award and increments. One-off costs in 2010/11 for youth inclusion strategy consultation (£5,145) and community strategy refresh (£6,000). (2,155) 60,110 £9,460 - Recharges now allocated on a per head basis including employee related insurances and Admin Buildings. £5,460 - Computer Applications Team. £11,450 Accountancy and Internal Audit. £29,230 - Corporate Leadership Team 52,200 11,420 £7,580 - Recharges now allocated on a per head basis including employee related insurances, central costs and Admin Buildings. £4,160 - Accountancy. (23,968) 20,308 £4,853 - Pay award and increments. £15,455 - Equipment budget transferred from Community Safety. 59,764 £59,764 - Removal of previous credit in relation to Government Grants Deferred, due to changes under IFRS. 7,304 £7,304 - Lower contributions from businesses, in line with 2010/11 actual contributions. 14,510 No Major Variances 101,886 (25,065) 0 59,764 9,803 98,220 142,722
