MONITORING EKG LAB HMP 2.COMP INTRODUCTION
advertisement

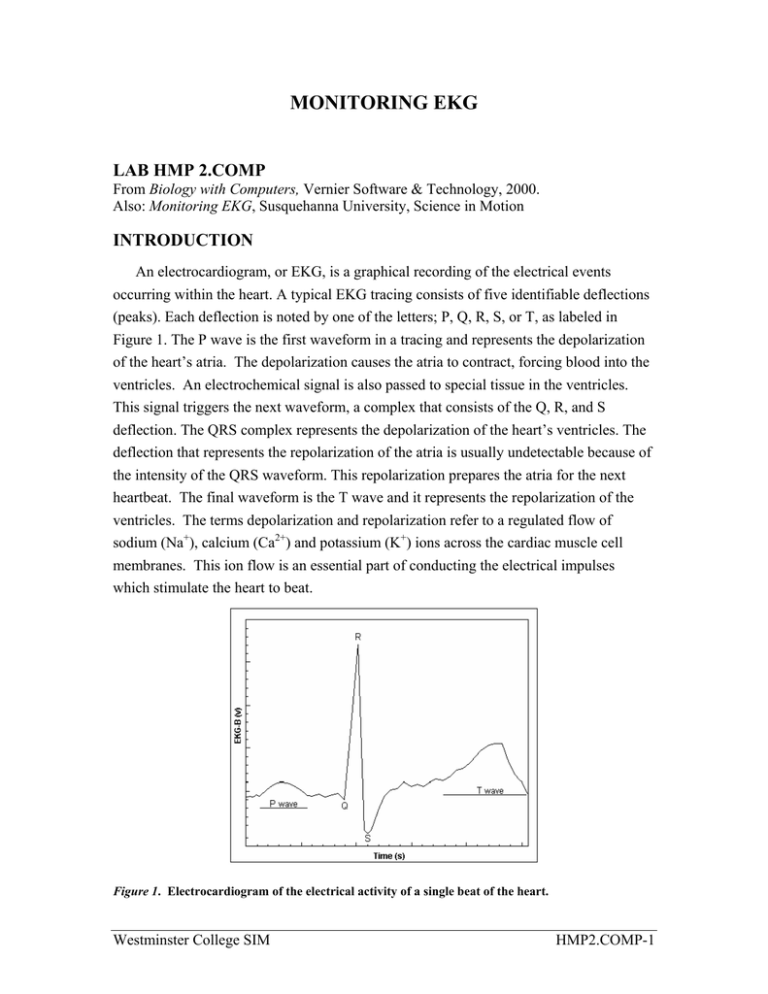
MONITORING EKG LAB HMP 2.COMP From Biology with Computers, Vernier Software & Technology, 2000. Also: Monitoring EKG, Susquehanna University, Science in Motion INTRODUCTION An electrocardiogram, or EKG, is a graphical recording of the electrical events occurring within the heart. A typical EKG tracing consists of five identifiable deflections (peaks). Each deflection is noted by one of the letters; P, Q, R, S, or T, as labeled in Figure 1. The P wave is the first waveform in a tracing and represents the depolarization of the heart’s atria. The depolarization causes the atria to contract, forcing blood into the ventricles. An electrochemical signal is also passed to special tissue in the ventricles. This signal triggers the next waveform, a complex that consists of the Q, R, and S deflection. The QRS complex represents the depolarization of the heart’s ventricles. The deflection that represents the repolarization of the atria is usually undetectable because of the intensity of the QRS waveform. This repolarization prepares the atria for the next heartbeat. The final waveform is the T wave and it represents the repolarization of the ventricles. The terms depolarization and repolarization refer to a regulated flow of sodium (Na+), calcium (Ca2+) and potassium (K+) ions across the cardiac muscle cell membranes. This ion flow is an essential part of conducting the electrical impulses which stimulate the heart to beat. Figure 1. Electrocardiogram of the electrical activity of a single beat of the heart. Westminster College SIM HMP2.COMP-1 Monitoring EKG Because an EKG is a recording of the heart’s electrical events, it is valuable in diagnosing diseases or ailments that damage the conductive abilities of the heart muscle. When cardiac muscle cells are damaged or destroyed, they are no longer able to conduct the electrical impulses that flow through them. This results in termination of the electrical signal at the damaged tissue or in a redirection of the electrical signal away from its normal flow. The termination or redirection of the electrical signal will alter the manner in which the heart contracts. A cardiologist can look at a patient’s electrocardiogram and determine the presence of damaged cardiac muscle based on the time interval between electrical events. In this activity, you will use the EKG sensor to make a five-second graphical recording of your heart's electrical events. From this recording, you will determine the time interval associated with each of the previously mentioned EKG waveforms. PURPOSE The purpose of this experiment is use the EKG Sensor to collect an EKG waveform, and then use the waveform to determine the time interval between EKG events and to calculate the heart rate. MATERIALS Laptop computer with Logger Lite Go! Link Vernier EKG Sensor disposable electrode tabs PROCEDURE 1. Connect the EKG probe to the GO! Link cable. Plug the cable into the USB port on the right side of the computer. 2. Turn on the computer. At the first window, type in: User: guest Password: (leave blank) Select “Workstation only” box Hit “Enter”. 3. Open Logger Lite 1.1 by double-clicking on the green Logger Lite 1.3.2.lnk icon on the desktop. 4. The program will open and give you a message that essentially says that a probe is connected but it needs to be identified. Click on “Experiment” on the menu bar, go to “Set Up Sensors”, then “Show All Interfaces”. 5. On the left hand side of the Interface window is an alphabetical list of the probes compatible with the GO! Link. Scroll down until you find the EKG probe. 6. Click on the EKG sensor and drag it from the left side of the sensor window to the small empty white box at the top right of the window. (The icon should change from a ; to a . when the sensor icon is in the right spot.) Once the probe is identified, the Westminster College SIM HMP2.COMP-2 Monitoring EKG program should bring up the appropriate graph. The EKG graph will show Potential (mV) vs. time (s). 7. To change the parameters for data collection, go to “Experiment” on the menu bar, then choose “Data Collection…”. For the EKG lab, the parameters should be the following: Mode: time based Length: 5 sec 100 samples/sec Click “Done” when you are finished! The graph X-axis should be changed to 5 sec (vs. the default at 3 sec). 8. Attach three electrode tabs to your arms, as shown in Figure 2. A single patch should be placed on the inside of the right wrist, on the inside of the right upper forearm (below elbow), and on the inside of the left upper forearm (below elbow). 9. Connect the EKG clips to the electrode tabs as shown in Figure 2. Sit in a reclined position in a chair or lay flat on top of a lab table. The arms should be hanging at the side unsupported. When everything is positioned properly, click Collect to begin data collection. Figure 2. Green (negative) Red (positive) Black (ground) 10. The computer will automatically collect data for 5 seconds, resulting in a graph that has a series of heartbeats. Check for a stable baseline (i.e. the QRS peak of all the heart beats is in the same mV range and the recording between these peaks is fairly level). Repeat data collection until a stable baseline is achieved. 11. When data has been collected, click the examine button, , to analyze the data. As you move the mouse pointer across the screen, the x and y values are displayed in the Examine window that appears. Identify the various EKG waveforms using Figure 1 and determine the time intervals listed below. Record the time intervals in Table 1: “Resting” State. Figure 3. EKG with stable baseline Westminster College SIM HMP2.COMP-3 Monitoring EKG • P-R interval: time from the beginning of P wave to the start of the QRS complex. • QRS interval: time from Q deflection to S deflection. • Q-T interval: time from Q deflection to the end of the T wave. • Heart Cycle: time from beginning of the P wave to the end of the T wave. 12. Every “R” peak is a reliable representation of a heart beat. Count the number of peaks to determine heart rate in beats/5 sec using the EKG data. Multiply by 12 to determine heart beats/minute, or BPM. 13. Remove the EKG clips from the electrode tabs. Perform some form of physical exercise for 2-3 min. (ex. run up and down the stairs; walk up and down the hallway briskly). If you have a known heart problem, do not perform this part of the experiment. Likewise, if you feel dizzy or light-headed, or unreasonably short of breath, stop the exercise immediately. 14. Replace the EKG clips and take a second set of readings. It may be more difficult to obtain a stable baseline with these readings. Record these in Table 2: Post-Exercise. Westminster College SIM HMP2.COMP-4 Monitoring EKG DATA SHEET Name ________________________ Period _______ Class ___________ Date ___________ MONITORING EKG Seconds at Q: P-R Table 1: “Resting” State Seconds at start Elapsed Seconds of P wave: (Q sec – P sec) ________ Beat 1 ________ Beat 1 ________ Beat 1 Normal Range: 0.12 to 0.20 s ________ Beat 2 ________ Beat 2 ________ Beat 2 ________ Beat 3 ________ Beat 3 ________ Beat 3 Avg. _________ Seconds at S: Seconds at Q: Elapsed Seconds (S sec – Q sec) ________ Beat 1 ________ Beat 1 ________ Beat 1 Normal Range: QRS ________ Beat 2 ________ Beat 2 ________ Beat 2 less than 0.10 s ________ Beat 3 ________ Beat 3 ________ Beat 3 Avg. _________ Seconds at end of T wave: Seconds at Q: Elapsed Seconds (TS sec – Q sec) ________ Beat 1 Q-T ________ Beat 1 ________ Beat 1 Normal Range: ________ Beat 2 0.30 – 0.40 s ________ Beat 2 ________ Beat 2 ________ Beat 3 ________ Beat 3 ________ Beat 3 Avg. _________ Heart rate (# beats per 5 seconds): ____________ Heart rate (beats per min): ___________ Westminster College SIM HMP2.COMP-5 Monitoring EKG Seconds at Q: P-R Table 2: Post-Exercise Seconds at start Elapsed Seconds of P wave: (Q sec – P sec) ________ Beat 1 ________ Beat 1 ________ Beat 1 Normal Range: 0.12 to 0.20 s ________ Beat 2 ________ Beat 2 ________ Beat 2 ________ Beat 3 ________ Beat 3 ________ Beat 3 Avg. _________ Seconds at S: Seconds at Q: Elapsed Seconds (S sec – Q sec) ________ Beat 1 ________ Beat 1 ________ Beat 1 Normal Range: QRS ________ Beat 2 ________ Beat 2 ________ Beat 2 less than 0.10 s ________ Beat 3 ________ Beat 3 ________ Beat 3 Avg. _________ Seconds at end Seconds at Q: Q-T of T wave: Elapsed Seconds (TS sec – Q sec) ________ Beat 1 ________ Beat 1 ________ Beat 1 Normal Range: ________ Beat 2 0.30 – 0.40 s ________ Beat 2 ________ Beat 2 ________ Beat 3 ________ Beat 3 ________ Beat 3 Avg. _________ Heart rate (# beats per 5 seconds): ____________ Heart rate (beats per min): ___________ NOTE: If your EKG data does not fall in the “Normal Range”, it is not necessarily a cause for concern. This equipment is not sensitive enough to produce reliable data on the health and fitness of your heart. If you are truly concerned by your results, you should consult a medical doctor. Westminster College SIM HMP2.COMP-6 Monitoring EKG Name: _______________________ Date: _______________________ QUESTIONS 1. The electrocardiogram is a powerful tool used to diagnose certain types of heart disease. Why is it important to look at time intervals of the different waveforms? 2. What property of heart muscle must be altered in order for an EKG to detect a problem? Explain. 3. Why can’t an EKG be used to diagnose all diseases or defects of the heart? 4. Name and describe a cardiovascular problem that could be diagnosed by a cardiologist using a electrocardiogram recording. 5. Examine your “resting” and post-exercise heart rate. How do they differ? What is the effect on the heart muscle? Why should someone with a known heart problem be cautious about performing this part of the experiment? Westminster College SIM HMP2.COMP-7 Monitoring EKG Name: _______________________ Date: _______________________ Pre-Lab Quiz for “Monitoring EKG” Lab 1. What is being recorded by an electrocardiogram (EKG)? 2. An EKG can detect when cardiac muscle cells are damaged or destroyed. a. What is disrupted by the damaged or destroyed cells? b. What changes in the EKG graph help a cardiologist detect the damage? 3. When the atria or ventricles depolarize, what is happening to the heart muscle? 4. When analyzing the EKG data, why is it important to record data from at least three different heartbeats? 5. What are the three (3) ions that are important for transmitting the signal for the heart to beat? 6. Why are you unable to detect the repolarization of the atria on an EKG trace? Westminster College SIM HMP2.COMP-8


