PROBLEMS WITH THE NONSEQUENTIAL YOS VARIABLE IN DOD CIVIL SERVICE DATA
advertisement
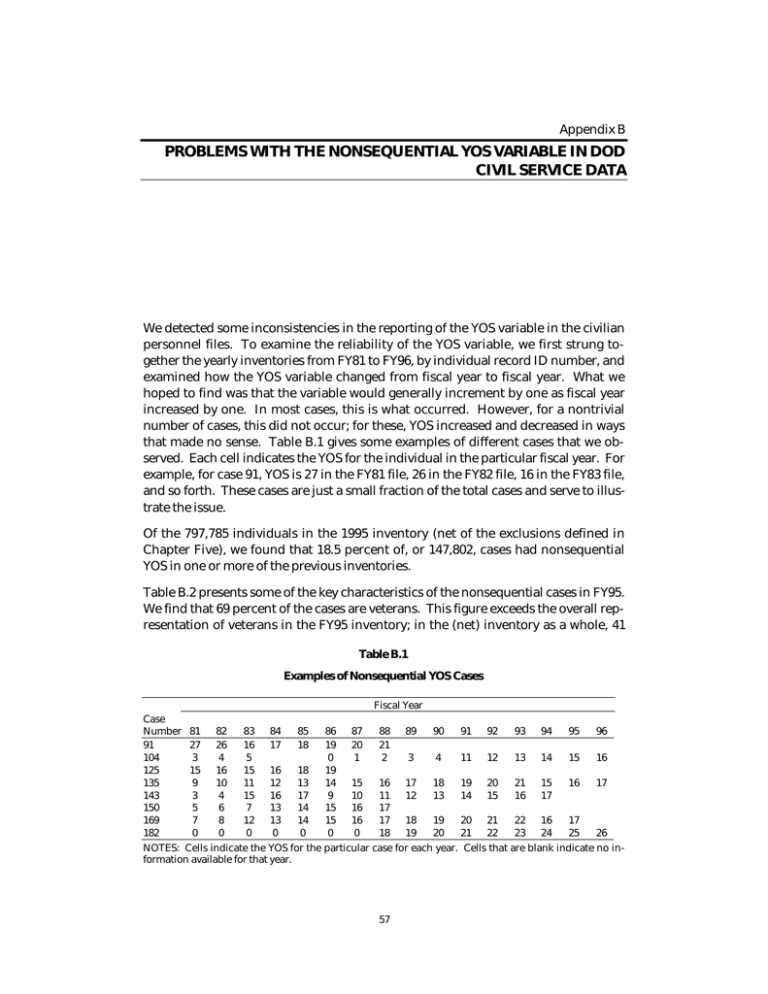
Appendix B PROBLEMS WITH THE NONSEQUENTIAL YOS VARIABLE IN DOD CIVIL SERVICE DATA We detected some inconsistencies in the reporting of the YOS variable in the civilian personnel files. To examine the reliability of the YOS variable, we first strung together the yearly inventories from FY81 to FY96, by individual record ID number, and examined how the YOS variable changed from fiscal year to fiscal year. What we hoped to find was that the variable would generally increment by one as fiscal year increased by one. In most cases, this is what occurred. However, for a nontrivial number of cases, this did not occur; for these, YOS increased and decreased in ways that made no sense. Table B.1 gives some examples of different cases that we observed. Each cell indicates the YOS for the individual in the particular fiscal year. For example, for case 91, YOS is 27 in the FY81 file, 26 in the FY82 file, 16 in the FY83 file, and so forth. These cases are just a small fraction of the total cases and serve to illustrate the issue. Of the 797,785 individuals in the 1995 inventory (net of the exclusions defined in Chapter Five), we found that 18.5 percent of, or 147,802, cases had nonsequential YOS in one or more of the previous inventories. Table B.2 presents some of the key characteristics of the nonsequential cases in FY95. We find that 69 percent of the cases are veterans. This figure exceeds the overall representation of veterans in the FY95 inventory; in the (net) inventory as a whole, 41 Table B.1 Examples of Nonsequential YOS Cases Fiscal Year Case Number 81 82 83 84 85 86 87 88 89 90 91 92 93 94 95 96 91 27 26 16 17 18 19 20 21 104 3 4 5 0 1 2 3 4 11 12 13 14 15 16 125 15 16 15 16 18 19 135 9 10 11 12 13 14 15 16 17 18 19 20 21 15 16 17 143 3 4 15 16 17 9 10 11 12 13 14 15 16 17 150 5 6 7 13 14 15 16 17 169 7 8 12 13 14 15 16 17 18 19 20 21 22 16 17 182 0 0 0 0 0 0 0 18 19 20 21 22 23 24 25 26 NOTES: Cells indicate the YOS for the particular case for each year. Cells that are blank indicate no information available for that year. 57 58 Separation and Retirement Incentives in the Federal Civil Service percent are veterans. We also find that 43 percent are in the Air Force, whereas only 22 percent of the FY95 inventory as a whole are Air Force personnel. Therefore, Air Force personnel are overrepresented among the nonsequential cases. The nonsequential cases are also concentrated among a small subset of defense agencies. In fact, 66 percent of the nonsequential cases are accounted for by 18 agencies/bureaus (see Table B.2). A large number of cases are in the Air Materiel Command. Finally, of the 98,499 cases that are accounted for by these 18 agencies, about 75 percent are veterans. The figures in Table B.2 suggest that specific agencies, particularly in the Air Force, have difficulty consistently reporting the YOS of veterans. Table B.2 Key Characteristics of Nonsequential YOS Cases in FY95 (numbers and percentages) Characteristic Total Air Force Bureau Headquarters, Air Force Reserve Aerospace Defense Command Air Training Command Air Force Southern Command Air National Guard Units Air Materiel Command U.S. Army Corps of Engineers U.S. Army Forces Command U.S. Army Medical Command Army National Guard Units U.S. Army Training and Doctrine Command U.S. Navy Sea Systems Command Naval Air Systems Command Naval Facilities Engineering Command Defense Logistics Agency Dependents School Defense Commissary Agency Defense Finance and Accounting Service Total bureau Total Percentage Number of Cases 147,802 100.00% 64,075 43.35% 9,933 4,622 4,594 3,450 5,380 26,728 3,356 5,730 5,124 5,754 4,128 5,172 3,530 2,715 4,874 3,409 4,522 2,534 98,499 6.72% 3.13% 3.11% 2.33% 3.64% 18.08% 2.27% 3.88% 3.47% 4.89% 2.79% 3.50% 2.39% 1.84% 3.30% 2.31% 3.06% 1.71% 66.43% Veterans Percentage Number of Total 102,256 69.18% 55,229 86.19% 9,414 3,855 3,827 2,886 3,248 24,303 1,645 4,102 2,411 3,317 2,776 3,281 2,405 1,697 3,058 1,143 1,828 1,118 73,190 94.80% 83.41% 83.30% 83.65% 60.37% 90.93% 49.02% 71.59% 47.05% 54.52% 67.25% 63.44% 68.13% 62.51% 62.74% 33.53% 40.43% 44.12% 74.31%
