Document 12625201
advertisement
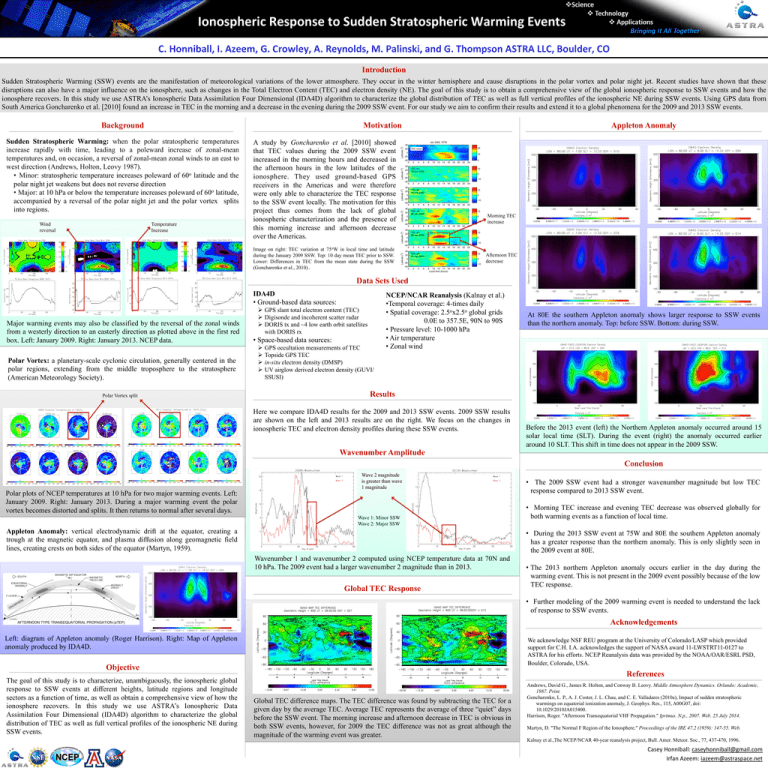
Ionospheric Response to Sudden Stratospheric Warming Events C. Honniball, I. Azeem, G. Crowley, A. Reynolds, M. Palinski, and G. Thompson ASTRA LLC, Boulder, CO Introduction Sudden Stratospheric Warming (SSW) events are the manifestation of meteorological variations of the lower atmosphere. They occur in the winter hemisphere and cause disruptions in the polar vortex and polar night jet. Recent studies have shown that these disruptions can also have a major influence on the ionosphere, such as changes in the Total Electron Content (TEC) and electron density (NE). The goal of this study is to obtain a comprehensive view of the global ionospheric response to SSW events and how the ionosphere recovers. In this study we use ASTRA’s Ionospheric Data Assimilation Four Dimensional (IDA4D) algorithm to characterize the global distribution of TEC as well as full vertical profiles of the ionospheric NE during SSW events. Using GPS data from South America Goncharenko et al. [2010] found an increase in TEC in the morning and a decrease in the evening during the 2009 SSW event. For our study we aim to confirm their results and extend it to a global phenomena for the 2009 and 2013 SSW events. Background Motivation Sudden Stratospheric Warming: when the polar stratospheric temperatures increase rapidly with time, leading to a poleward increase of zonal-mean temperatures and, on occasion, a reversal of zonal-mean zonal winds to an east to west direction (Andrews, Holton, Leovy 1987). • Minor: stratospheric temperature increases poleward of 60o latitude and the polar night jet weakens but does not reverse direction • Major: at 10 hPa or below the temperature increases poleward of 60o latitude, accompanied by a reversal of the polar night jet and the polar vortex splits into regions. Wind reversal Temperature Increase A study by Goncharenko et al. [2010] showed that TEC values during the 2009 SSW event increased in the morning hours and decreased in the afternoon hours in the low latitudes of the ionosphere. They used ground-based GPS receivers in the Americas and were therefore were only able to characterize the TEC response to the SSW event locally. The motivation for this project thus comes from the lack of global ionospheric characterization and the presence of this morning increase and afternoon decrease over the Americas. Image on right: TEC variation at 75oW in local time and latitude during the January 2009 SSW. Top: 10 day mean TEC prior to SSW. Lower: Differences in TEC from the mean state during the SSW (Goncharenko et al., 2010) . Appleton Anomaly Morning TEC increase Afternoon TEC decrease Data Sets Used IDA4D • Ground-based data sources: Major warming events may also be classified by the reversal of the zonal winds from a westerly direction to an easterly direction as plotted above in the first red box. Left: January 2009. Right: January 2013. NCEP data. Polar Vortex: a planetary-scale cyclonic circulation, generally centered in the polar regions, extending from the middle troposphere to the stratosphere (American Meteorology Society). Polar Vortex split GPS slant total electron content (TEC) Digisonde and incoherent scatter radar DORIS tx and ~4 low earth orbit satellites with DORIS rx • Space-based data sources: GPS occultation measurements of TEC Topside GPS TEC in-situ electron density (DMSP) UV airglow derived electron density (GUVI/ SSUSI) NCEP/NCAR Reanalysis (Kalnay et al.) • Temporal coverage: 4-times daily • Spatial coverage: 2.5ox2.5o global grids 0.0E to 357.5E, 90N to 90S • Pressure level: 10-1000 hPa • Air temperature • Zonal wind At 80E the southern Appleton anomaly shows larger response to SSW events than the northern anomaly. Top: before SSW. Bottom: during SSW. Results Here we compare IDA4D results for the 2009 and 2013 SSW events. 2009 SSW results are shown on the left and 2013 results are on the right. We focus on the changes in ionospheric TEC and electron density profiles during these SSW events. Wavenumber Amplitude Before the 2013 event (left) the Northern Appleton anomaly occurred around 15 solar local time (SLT). During the event (right) the anomaly occurred earlier around 10 SLT. This shift in time does not appear in the 2009 SSW. Conclusion Polar plots of NCEP temperatures at 10 hPa for two major warming events. Left: January 2009. Right: January 2013. During a major warming event the polar vortex becomes distorted and splits. It then returns to normal after several days. Wave 2 magnitude is greater than wave 1 magnitude Wave 1: Minor SSW Wave 2: Major SSW Appleton Anomaly: vertical electrodynamic drift at the equator, creating a trough at the magnetic equator, and plasma diffusion along geomagnetic field lines, creating crests on both sides of the equator (Martyn, 1959). • The 2009 SSW event had a stronger wavenumber magnitude but low TEC response compared to 2013 SSW event. • Morning TEC increase and evening TEC decrease was observed globally for both warming events as a function of local time. • During the 2013 SSW event at 75W and 80E the southern Appleton anomaly has a greater response than the northern anomaly. This is only slightly seen in the 2009 event at 80E. Wavenumber 1 and wavenumber 2 computed using NCEP temperature data at 70N and 10 hPa. The 2009 event had a larger wavenumber 2 magnitude than in 2013. Global TEC Response • The 2013 northern Appleton anomaly occurs earlier in the day during the warming event. This is not present in the 2009 event possibly because of the low TEC response. • Further modeling of the 2009 warming event is needed to understand the lack of response to SSW events. Acknowledgements Left: diagram of Appleton anomaly (Roger Harrison). Right: Map of Appleton anomaly produced by IDA4D. We acknowledge NSF REU program at the University of Colorado/LASP which provided support for C.H. I.A. acknowledges the support of NASA award 11-LWSTRT11-0127 to ASTRA for his efforts. NCEP Reanalysis data was provided by the NOAA/OAR/ESRL PSD, Boulder, Colorado, USA. Objective The goal of this study is to characterize, unambiguously, the ionospheric global response to SSW events at different heights, latitude regions and longitude sectors as a function of time, as well as obtain a comprehensive view of how the ionosphere recovers. In this study we use ASTRA’s Ionospheric Data Assimilation Four Dimensional (IDA4D) algorithm to characterize the global distribution of TEC as well as full vertical profiles of the ionospheric NE during SSW events. References Global TEC difference maps. The TEC difference was found by subtracting the TEC for a given day by the average TEC. Average TEC represents the average of three “quiet” days before the SSW event. The morning increase and afternoon decrease in TEC is obvious in both SSW events, however, for 2009 the TEC difference was not as great although the magnitude of the warming event was greater. Andrews, David G., James R. Holton, and Conway B. Leovy. Middle Atmosphere Dynamics. Orlando: Academic, 1987. Print. Goncharenko, L. P., A. J. Coster, J. L. Chau, and C. E. Valladares (2010a), Impact of sudden stratospheric warmings on equatorial ionization anomaly, J. Geophys. Res., 115, A00G07, doi: 10.1029/2010JA015400. Harrison, Roger. "Afternoon Transequatorial VHF Propagation." Iprimus. N.p., 2007. Web. 25 July 2014. Martyn, D. "The Normal F Region of the Ionosphere." Proceedings of the IRE 47.2 (1959): 147-55. Web. Kalnay et al.,The NCEP/NCAR 40-year reanalysis project, Bull. Amer. Meteor. Soc., 77, 437-470, 1996. Casey Honniball: caseyhonniball@gmail.com Irfan Azeem: iazeem@astraspace.net
