Plug-In Hybrid Electric Vehicles and Wind Energy OVERVIEW OF PHEVS
advertisement
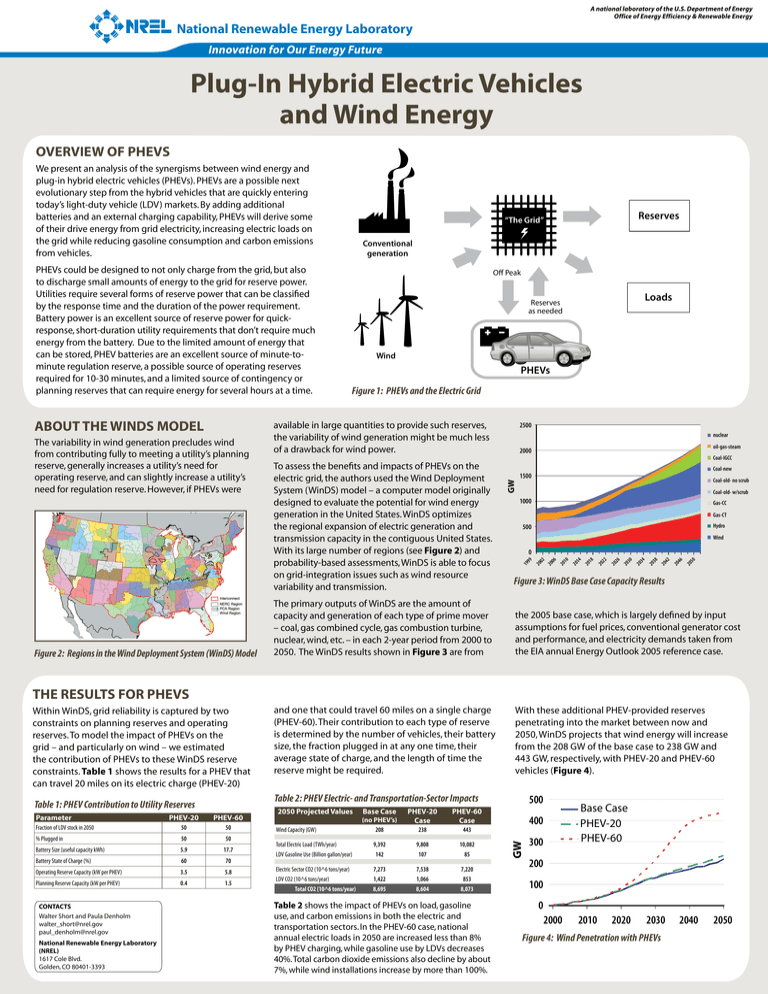
Plug-In Hybrid Electric Vehicles and Wind Energy OVERVIEW OF PHEVS We present an analysis of the synergisms between wind energy and plug-in hybrid electric vehicles (PHEVs). PHEVs are a possible next evolutionary step from the hybrid vehicles that are quickly entering today’s light-duty vehicle (LDV) markets. By adding additional batteries and an external charging capability, PHEVs will derive some of their drive energy from grid electricity, increasing electric loads on the grid while reducing gasoline consumption and carbon emissions from vehicles. Figure 2: Regions in the Wind Deployment System (WinDS) Model Loads Reserves as needed Wind PHEVs Figure 1: PHEVs and the Electric Grid available in large quantities to provide such reserves, the variability of wind generation might be much less of a drawback for wind power. nuclear oil-gas-steam 2000 Coal-IGCC Coal-new 1500 Coal-old- no scrub Coal-old- w/scrub 1000 Gas-CC Gas-CT Hydro 500 Wind 50 20 46 20 42 20 38 20 34 20 30 20 26 20 22 20 18 20 14 20 10 20 06 20 02 0 99 To assess the benefits and impacts of PHEVs on the electric grid, the authors used the Wind Deployment System (WinDS) model – a computer model originally designed to evaluate the potential for wind energy generation in the United States. WinDS optimizes the regional expansion of electric generation and transmission capacity in the contiguous United States. With its large number of regions (see Figure 2) and probability-based assessments, WinDS is able to focus on grid-integration issues such as wind resource variability and transmission. 2500 19 The variability in wind generation precludes wind from contributing fully to meeting a utility’s planning reserve, generally increases a utility’s need for operating reserve, and can slightly increase a utility’s need for regulation reserve. However, if PHEVs were Off Peak GW ABOUT THE WINDS MODEL Conventional generation 20 PHEVs could be designed to not only charge from the grid, but also to discharge small amounts of energy to the grid for reserve power. Utilities require several forms of reserve power that can be classified by the response time and the duration of the power requirement. Battery power is an excellent source of reserve power for quickresponse, short-duration utility requirements that don’t require much energy from the battery. Due to the limited amount of energy that can be stored, PHEV batteries are an excellent source of minute-tominute regulation reserve, a possible source of operating reserves required for 10-30 minutes, and a limited source of contingency or planning reserves that can require energy for several hours at a time. Reserves “The Grid” Figure 3: WinDS Base Case Capacity Results The primary outputs of WinDS are the amount of capacity and generation of each type of prime mover – coal, gas combined cycle, gas combustion turbine, nuclear, wind, etc. – in each 2-year period from 2000 to 2050. The WinDS results shown in Figure 3 are from the 2005 base case, which is largely defined by input assumptions for fuel prices, conventional generator cost and performance, and electricity demands taken from the EIA annual Energy Outlook 2005 reference case. and one that could travel 60 miles on a single charge (PHEV-60). Their contribution to each type of reserve is determined by the number of vehicles, their battery size, the fraction plugged in at any one time, their average state of charge, and the length of time the reserve might be required. With these additional PHEV-provided reserves penetrating into the market between now and 2050, WinDS projects that wind energy will increase from the 208 GW of the base case to 238 GW and 443 GW, respectively, with PHEV-20 and PHEV-60 vehicles (Figure 4). THE RESULTS FOR PHEVS Within WinDS, grid reliability is captured by two constraints on planning reserves and operating reserves. To model the impact of PHEVs on the grid – and particularly on wind – we estimated the contribution of PHEVs to these WinDS reserve constraints. Table 1 shows the results for a PHEV that can travel 20 miles on its electric charge (PHEV-20) Table 2: PHEV Electric- and Transportation-Sector Impacts Parameter PHEV-20 PHEV-60 Fraction of LDV stock in 2050 50 50 % Plugged in 50 50 Battery Size (useful capacity kWh) 5.9 17.7 Battery State of Charge (%) 60 70 Operating Reserve Capacity (kW per PHEV) 3.5 5.8 Planning Reserve Capacity (kW per PHEV) 0.4 1.5 Contacts Walter Short and Paula Denholm walter_short@nrel.gov paul_denholm@nrel.gov National Renewable Energy Laboratory (NREL) 1617 Cole Blvd. Golden, CO 80401-3393 2050 Projected Values (no PHEV’s) PHEV-20 Case PHEV-60 Case 208 238 443 9,392 9,808 10,082 LDV Gasoline Use (Billion gallon/year) 142 107 85 Electric Sector CO2 (10^6 tons/year) 7,273 7,538 7,220 LDV CO2 (10^6 tons/year) 1,422 1,066 853 8,695 8,604 8,073 Wind Capacity (GW) Total Electric Load (TWh/year) Total CO2 (10^6 tons/year) Base Case Table 2 shows the impact of PHEVs on load, gasoline use, and carbon emissions in both the electric and transportation sectors. In the PHEV-60 case, national annual electric loads in 2050 are increased less than 8% by PHEV charging, while gasoline use by LDVs decreases 40%. Total carbon dioxide emissions also decline by about 7%, while wind installations increase by more than 100%. Base Case PHEV-20 PHEV-60 400 GW Table 1: PHEV Contribution to Utility Reserves 500 300 200 100 0 2000 2010 2020 2030 Figure 4: Wind Penetration with PHEVs 2040 2050
