The Impact of Charging Plug-in Hybrid Electric Vehicles on the
advertisement
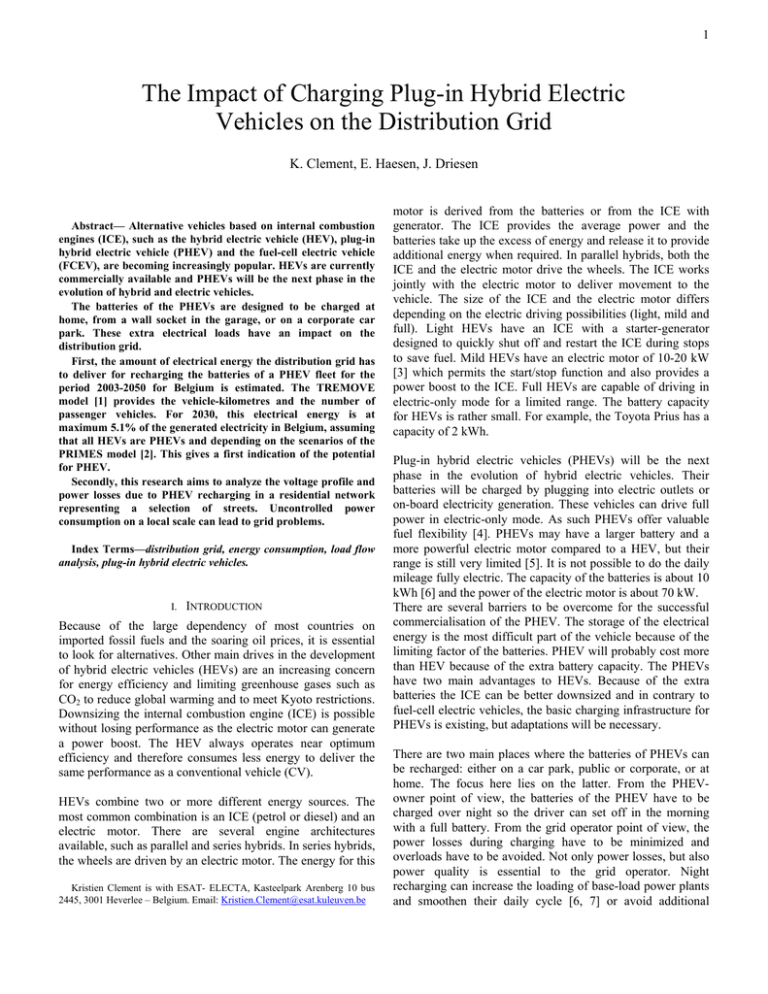
1 The Impact of Charging Plug-in Hybrid Electric Vehicles on the Distribution Grid K. Clement, E. Haesen, J. Driesen Abstract— Alternative vehicles based on internal combustion engines (ICE), such as the hybrid electric vehicle (HEV), plug-in hybrid electric vehicle (PHEV) and the fuel-cell electric vehicle (FCEV), are becoming increasingly popular. HEVs are currently commercially available and PHEVs will be the next phase in the evolution of hybrid and electric vehicles. The batteries of the PHEVs are designed to be charged at home, from a wall socket in the garage, or on a corporate car park. These extra electrical loads have an impact on the distribution grid. First, the amount of electrical energy the distribution grid has to deliver for recharging the batteries of a PHEV fleet for the period 2003-2050 for Belgium is estimated. The TREMOVE model [1] provides the vehicle-kilometres and the number of passenger vehicles. For 2030, this electrical energy is at maximum 5.1% of the generated electricity in Belgium, assuming that all HEVs are PHEVs and depending on the scenarios of the PRIMES model [2]. This gives a first indication of the potential for PHEV. Secondly, this research aims to analyze the voltage profile and power losses due to PHEV recharging in a residential network representing a selection of streets. Uncontrolled power consumption on a local scale can lead to grid problems. Index Terms—distribution grid, energy consumption, load flow analysis, plug-in hybrid electric vehicles. I. INTRODUCTION Because of the large dependency of most countries on imported fossil fuels and the soaring oil prices, it is essential to look for alternatives. Other main drives in the development of hybrid electric vehicles (HEVs) are an increasing concern for energy efficiency and limiting greenhouse gases such as CO2 to reduce global warming and to meet Kyoto restrictions. Downsizing the internal combustion engine (ICE) is possible without losing performance as the electric motor can generate a power boost. The HEV always operates near optimum efficiency and therefore consumes less energy to deliver the same performance as a conventional vehicle (CV). HEVs combine two or more different energy sources. The most common combination is an ICE (petrol or diesel) and an electric motor. There are several engine architectures available, such as parallel and series hybrids. In series hybrids, the wheels are driven by an electric motor. The energy for this Kristien Clement is with ESAT- ELECTA, Kasteelpark Arenberg 10 bus 2445, 3001 Heverlee – Belgium. Email: Kristien.Clement@esat.kuleuven.be motor is derived from the batteries or from the ICE with generator. The ICE provides the average power and the batteries take up the excess of energy and release it to provide additional energy when required. In parallel hybrids, both the ICE and the electric motor drive the wheels. The ICE works jointly with the electric motor to deliver movement to the vehicle. The size of the ICE and the electric motor differs depending on the electric driving possibilities (light, mild and full). Light HEVs have an ICE with a starter-generator designed to quickly shut off and restart the ICE during stops to save fuel. Mild HEVs have an electric motor of 10-20 kW [3] which permits the start/stop function and also provides a power boost to the ICE. Full HEVs are capable of driving in electric-only mode for a limited range. The battery capacity for HEVs is rather small. For example, the Toyota Prius has a capacity of 2 kWh. Plug-in hybrid electric vehicles (PHEVs) will be the next phase in the evolution of hybrid electric vehicles. Their batteries will be charged by plugging into electric outlets or on-board electricity generation. These vehicles can drive full power in electric-only mode. As such PHEVs offer valuable fuel flexibility [4]. PHEVs may have a larger battery and a more powerful electric motor compared to a HEV, but their range is still very limited [5]. It is not possible to do the daily mileage fully electric. The capacity of the batteries is about 10 kWh [6] and the power of the electric motor is about 70 kW. There are several barriers to be overcome for the successful commercialisation of the PHEV. The storage of the electrical energy is the most difficult part of the vehicle because of the limiting factor of the batteries. PHEV will probably cost more than HEV because of the extra battery capacity. The PHEVs have two main advantages to HEVs. Because of the extra batteries the ICE can be better downsized and in contrary to fuel-cell electric vehicles, the basic charging infrastructure for PHEVs is existing, but adaptations will be necessary. There are two main places where the batteries of PHEVs can be recharged: either on a car park, public or corporate, or at home. The focus here lies on the latter. From the PHEVowner point of view, the batteries of the PHEV have to be charged over night so the driver can set off in the morning with a full battery. From the grid operator point of view, the power losses during charging have to be minimized and overloads have to be avoided. Not only power losses, but also power quality is essential to the grid operator. Night recharging can increase the loading of base-load power plants and smoothen their daily cycle [6, 7] or avoid additional 2 II. GENERAL OVERVIEW: TRENDS TO 2030 A. The Belgian vehicle fleet TREMOVE [1] quantified the Belgian passenger vehicles for the period 2005-2030 based on a simulation of consumer behaviour within a business as usual scenario (Figure 1). In 2005, half of the Belgian market exists of petrol ICE CVs and the other half of diesel ICE CVs. The fleet of both diesel and petrol HEVs will be enormously increased by 2030 up to respectively 1 440 000 and 660 000 vehicles which is 35% of the diesel vehicles and 30% of the petrol vehicles. For new technologies, such as HEVs, it takes some time to penetrate the market, but they will have an important share after some years. HEVs will take over around 7% of the market by 2010 and around 30% by 2030. At 2010, the amount of diesel and petrol HEVs is equal and contains both 90 000 vehicles. The compressed natural gas (CNG) vehicles will have a share of 15% by 2030. Fuel-cell electric vehicles are not taking into account due to their production and cost uncertainty. vehicle-kilometres for diesel vehicles are enormously increasing in contradiction with the petrol vehicles. Figure 2 shows that vehicle-kilometres per year of diesel vehicles increase from 61 000 up to 70 000 million. In contrast, the vehicle-kilometres per year of petrol vehicles decrease slightly from 25 000 up to 23 000 million. 2003-2015 2015-2030 2030-2050 4.1-7.4 3.9-7 3.7-6.6 full HEVs, petrol 4.5-8 4.1-7.4 3.9-7 mild HEVs, petrol 4.9-8.8 4.6-8.3 4.3-7.7 light HEVs, petrol 3.2-5.7 3.1-5.5 3-5.4 full HEVs, diesel 3.4-6 3.2-5.8 3.1-5.5 mild HEVs, diesel 3.7-6.7 3.6-6.5 3.5-6.3 light HEVs, diesel Table I: Fuel economy of light duty vehicles (Litres of petrol equivalent/100km) [3] 1000 million vehicle-km/year generator start-ups which would enhance the general efficiency. The electrical consumption for charging PHEVs will take in at worse about 5% of the total electrical consumption in Belgium [8] assuming that all HEVs are PHEVs and depending on the scenarios of the PRIMES model. This would be taken from the low voltage grid. The impact of charging the PHEVs batteries is not yet understood, but the authors believe that it could cause a high risk of overload. 140 120 100 80 60 40 20 0 1995 2000 2005 2010 2015 2020 2025 2030 year CNG vehicle Petrol vehicle Diesel vehicle LDV HDV number of vehicles Figure 2 Transport volumes (1000 million vehicle-km/year) [1] III. THE ELECTRICAL CONSUMPTION 7000000 6000000 5000000 4000000 3000000 2000000 1000000 0 1995 2000 2005 2010 2015 2020 2025 2030 year Petrol HEV Diesel HEV Petrol CV Diesel CV CNG A. Approach The aim of this paragraph is to determine the amount of electrical energy of the distribution grid that is needed to charge the batteries of the PHEV for fulfilling the daily mileage. This amount of electrical energy can be compared with the total electricity consumption in Belgium. The period 2005-2030 will be examined and will be narrowed to 20102030 because the HEVs breakthrough is not significant until 2010. Figure 1: The evolution of the Belgian vehicle fleet [1] B. The fuel economy of hybrid electric vehicles Table I gives an idea of the efficiency of HEVs for the period 2003-2050 [3]. The study of McKinsey [9] expects a consumption of 7.6 l/100 km for petrol ICE vehicles and 6.1 l/100 km for petrol HEVs for the year 2005. For 2020, the consumption of ICE vehicles will decrease up to 6.0 l/100 km and for hybrid vehicles up to 5.1 l/100 km. C. The transport volumes per vehicle type TREMOVE has determined the vehicle-kilometres per year and per vehicle type for Belgium, as shown in Figure 2. LDV and HDV are respectively light and heavy duty vehicles. The Table I gives the fuel consumption of HEVs. The batteries are charged through on-board electricity generation using ICEs fuelled with diesel or petrol. For a PHEV, not all the electrical energy for recharging is generated on-board, but the batteries can be charged with electrical energy from the distribution grid. This can reduce both fuel consumption and fuel cycle emissions because power plants may have higher energy efficiency and lower emissions than vehicles. The size of the battery is crucial. It is difficult to predict the proportion of electric driving and the proportion of driving on diesel or petrol of a PHEV. This depends from vehicle to vehicle and from trip to trip. 50% electrical driving is assumed here. This gives us the possibility to calculate the electrical energy a PHEV consumes per day. Taking into account that the battery can store a maximum of electrical energy, the electrical energy delivered by the distribution grid is limited and can be determined. Figure 1 gives only information about the HEV and not about PHEV, but PHEV can be taken as an option within the HEV. 2010 2015 2020 2025 2030 Electrical consumption [TWh/year] capacity [kWh/ vehicle-day] daily km [km/ day-vehicle] B. Results PHEVs are usually full hybrid electric vehicles. The efficiency of the charger is also important. The battery will be charged and discharged with an efficiency of 90%. The average driven kilometres per vehicle type per day are computed. There is no reason to assume that HEVs will drive fewer or more kilometres compared to conventional vehicles. Assuming that these vehicles drive 50% of the time electric, the daily and yearly electrical consumption of these vehicles is shown in Table II. The daily vehicle kilometres are based on the model of TREMOVE. The maximum electrical consumption per vehicle-day for diesel PHEVs is 16.38 kWh and for petrol PHEV 10.87 kWh in the year 2010. 30.2 6.02-10.87 0.22-0.40 petrol PHEV 59.1 9.20-16.38 0.34-0.60 diesel PHEV 29.6 5.62-10.08 0.55-0.98 petrol PHEV 58.0 8.75-15.52 1.35-2.39 diesel PHEV 27.7 5.25-9.42 0.81-1.45 petrol PHEV 59.9 9.03-16.03 2.42-4.29 diesel PHEV 29.0 5.50-9.87 1.27-2.28 petrol PHEV 59.5 8.98-15.93 3.46-6.14 diesel PHEV 29.0 5.23-9.33 1.40-2.50 petrol PHEV 59.6 8.70-15.65 4.02-7.24 diesel PHEV Table II: The electrical consumption of PHEVs The Toyota Prius has a battery capacity of 2 kWh, but the converting PHEV kits have battery capacities ranging from 5 to 12 kWh [10] and the prototype of the DaimlerChrysler Sprinter has a capacity of 14.4 kWh, using Lithium-ion batteries [11]. Petrol PHEVs can drive 50% electric without on-board generation of electricity, so the electrical energy that is stored in the battery is coming from the distribution grid. Diesel PHEVs can not do their daily mileage with the energy of the distribution grid, but they need also on-board generation. It is essential to notice that the daily driven kilometres differ from year to year and from type of fuel (petrol or diesel). Petrol PHEVs have lower vehiclekilometres per year compared to diesel vehicles. The total consumption of the HEVs for Belgium, assuming that the fleet of hybrid vehicles will exist of 100% PHEVs is giving in Table II. These figures can be compared with the amount of generated electricity in Belgium to give an idea of the percentage they will take of the yearly consumed electricity. Figure 3 shows the prediction of the Commission 2030 [2] about the generated electricity according to the different scenarios. elektrical consumption [TWh] 3 140 120 100 80 60 40 20 0 2000 2005 2010 2015 2020 2025 2030 year baseline scenario Bpk15n Figure 3: Generated electricity: total electrical consumption [2] In the Bpk15n scenario reduces Belgium its energy CO2 emissions by 15% in 2030 compared to the 1990 level. The consumption according the Bpk15n scenario is 9.6% higher in 2030 compared to the baseline scenario. This information gives us the possibility to determine the proportion of the electrical consumption for charging PHEVs to the total electrical consumption in Belgium and is given in Table III. ratio for baseline ratio for Bpk15n scenario [%] scenario [%] 0.3 0.3 petrol PHEV 2010 0.5 0.5 diesel PHEV 0.8 0.8 petrol PHEV 2015 2.0 1.9 diesel PHEV 1.1 1.1 petrol PHEV 2020 3.4 3.1 diesel PHEV 1.7 1.6 petrol PHEV 2025 4.6 4.2 diesel PHEV 1.8 1.6 petrol PHEV 2030 5.1 4.7 diesel PHEV Table III: The electrical consumption of PHEVs compared with the electrical consumption in Belgium The electrical consumption for charging PHEVs will take in the worse case about 5.1% of the total electrical consumption in Belgium. It is also essential to remark that all this energy will be taken of the low voltage grid, for example at the standard electric outlet in the garage. Table III assumed a constant electric drive proportion of 50%. A limit or boundary condition for this variation is the amount of energy the batteries can store, assuming that PHEVs will only be charged at night and that there is no (quick) charge possibility during the day. IV. LOAD FLOW ANALYSIS Before introducing the planning of the charging of PHEVs, it is essential to know the impact of the charging without direct control. Without direct controlling, the PHEVs are starting to charge when they are plugged in or with a start-delay. Three different cases are investigated. First the vehicles will start charging between 0.00 and 2.00 a.m. until the battery is fullycharged. In a second case, the PHEVs are immediately plugged in when arriving at home after work which is between 6.00 and 8.00 p.m which is acceptable because at 4 21.00 p.m., most of the vehicles are parked [12]. In the last case, charging during the day is regarded. The impact on the low voltage grid in terms of power losses and voltage deviations is investigated. A. Grid topology The radial network used for this analysis is the IEEE 34 node test feeder shown in Figure 4. This network is downscaled from 24.9 kV to 230 V so this grid topology represents a residential radial network. The line impedances are adapted to achieve tolerable voltage deviations and power losses. Each node is a connection with a residential load and some of the connections which are randomly chosen, have PHEVs recharging. ~ Figure 4: Grid topology: grid with 34 nodes. B. Load scenarios Two load scenarios are analyzed. • Low load scenario: from the available set, the daily load profile with the highest peak during each season is chosen together with three randomly chosen daily load profiles. • High load scenario: from the available set, the four daily load profiles with the highest daily averages during each season are chosen. Two seasons are distinguished: winter and summer. Each scenario exists of four daily load profiles of Belgium. The daily load profiles cover 24 hours and the energy consumption is given per quarter of an hour. Figure 5 represents a randomly chosen household load for one day. 900 800 power [W] 700 600 500 400 300 200 C. Backward-forward sweep method The backward-forward sweep method is used for calculating the node-currents, line-currents and node-voltages. This method has two stages: the backward and the forward step. At the initialization step, a flat profile of 230 V is taken for the node-voltages. The backward and forward sweeps become a matrix multiplication. In the backward step, the currents are computed based on the voltages of the preceding iteration. In the forward step, the voltages are computed based on the voltage at the root node and the voltage drops of the lines between the nodes. The currents and voltages are updated iteratively until the stopping criterion, node-voltages based, is reached. The charging of the PHEVs is treated as an extra load of constant power together with daily load profiles. D. Methodology At the start of the day, for each node, one of the four daily profiles of the selected load scenario is randomly determined. For each scenario, four different cases depending on the penetration of the PHEVs can be distinguished. In the first case, no PHEVs are assumed so this is taken as reference case. The next three cases have a PHEV penetration of respectively 10, 50 and 100%. The number of the PHEVs is depending on the chosen scenario and the PHEVs are placed randomly. For instance for the 50%-penetration case, one half of the nodes will have a PHEV-load and these loads are randomly placed. In the reference case, none of the nodes will have PHEVs charging and in the 100% case, each of the nodes will have an extra electrical load because of the PHEVs. These extra loads of charging the PHEVs are added to the load of the households which is of course always present. The profile for charging the PHEVs is kept very elementary. The batteries of the vehicles will be charged with a constant power of 2.5 kW and an efficiency of about 90%. The period of charging takes 4 hours. The start of the PHEVs charging is randomly chosen for each individual vehicle within a specific period of time. The batteries of the vehicles will be empty at the end of the day and fully-charged at the morning after. In the first case, the start of the charging period is arbitrary chosen between 0.00 and 2.00 a.m. and is constant. Another important aspect is to check the impact when the vehicles would be charged when arriving at home (6.00 - 8.00 p.m.). The extra loads of the vehicles are going together with a peak in the electricity consumption of the households in the evening. In the last case, the charging starts between 1.00 and 2.00 p.m. For every quarter of an hour, the backward-forward sweep method is performed for computing the voltage at each node until convergence is obtained. The results are discussed in the next paragraph. 100 0 0 1 2 3 4 5 6 7 8 9 10 11 12 13 14 15 16 17 18 19 20 21 22 23 time [hours] Figure 5: Household load during winter time. E. Results For illustrating the impact of charging PHEVs without direct control, the power losses, the voltage deviations and profiles are considered in this paragraph. Table IV presents the ratio of the power losses to the total energy consumption of the households and the PHEVs. The 5 scenario season 0% low scenario high scenario penetration of PHEV 10% 50% 100% summer 2.6 2.9 6.7 winter 3.7 3.9 6.8 22.6 summer 2.9 3.1 6.7 23.8 24.4 winter 4.1 4.2 7.1 22.1 Table IV: ratio of power losses to total power in %, charging between 0.00 - 2.00 a.m. Not only the power losses, but also the voltage deviations of the grid voltage (230 V) are important for the operator of the distribution grid which is presented in Table V. The voltage deviations are only compared during the time of charging. The impact of the number of PHEVs is larger than the impact of the several scenarios for the same reason as mentioned above. Voltage deviations up to 10% are acceptable, so for a penetration of 10%, there is not a problem. But for a penetration of 50% and 100%, the voltage deviations are between 16 and more than 60%. This low power quality is not allowed according to the norm EN50160. scenario low scenario season summer 230 220 voltage [V] values are compared during the whole day and the average is taken over 3000 samples. The impact of the degree of penetration of the PHEVs is larger compared to the impact of choice of scenario. The power of the charger is always higher compared to the household loads which are presented in Figure 5. The low impact of the scenarios can be explained by the low maximum variation of the household loads during the night for the different scenarios which is about 25% in the worse scenario. A random peak of a household load during the night is not going to change the line losses radically because these losses are a kind of weighted average of all powers of the whole network for a specific period of time. The increase of the number of PHEVs indicates a significant increase in the ratio of power losses. 210 200 190 180 0 1 2 3 4 5 6 7 8 9 10 11 12 13 14 15 16 17 18 19 20 21 22 23 time [hours] 50% PHEV 0% PHEV Figure 6: Voltage profile with 50% PHEV compared to voltage profile with 0% PHEV It is important to know the impact of charging the vehicles without direct control, thus immediately after arriving at home. At 6.00 p.m., the largest part of the fleet is on the road and this amount is decreasing from this moment till 9.00 p.m., when only about 2.5% of the vehicles are on the road. Table VI and Table VII present respectively the power losses and the voltage deviations for start charging at 8.00 p.m. The impact is computed as an illustration to indicate why optimal charging of the PHEVs is advisable. These tables must be compared by Table IV and Table V. Both the power losses and the voltage deviations are higher for charging at 9.00 p.m. because the higher household loads. scenario season 0% penetration of PHEV 10% 50% 100% summer low scenario winter 2.6 3.4 8.8 29.3 3.7 4.6 10.4 29.6 summer 2.9 3.7 9.2 28.5 winter 4.1 5.0 10.8 29.7 Table VI: Ratio of power losses to total power in%, charging between 6.00 - 8.00 p.m. high scenario penetration of PHEV 0% 2.8 10% 50% 100% 4.9 16.6 62.0 3.2 winter 5.1 16.9 62.4 3.0 5.0 16.8 62.2 summer high scenario winter 3.6 5.3 17.3 62.5 Table V: Voltage deviations in %, charging between 0.00 - 2.00 a.m. Figure 6 represents the voltage profile of node 33 for the cases of 0% and 50% penetration of PHEVs. The high load scenario in the winter is chosen and the daily household load profiles for both nodes are the same. This figure represents only one charging example. There is clearly a decrease of the voltage in the case of 50% penetration during the charging period. Between 2.00 and 4.00 a.m., all the vehicles are charging and the voltage drop in these hours is the largest. The power needed for charging these vehicles is a significant amount higher compared to the household loads during the night. scenario low scenario high scenario season penetration of PHEV 0% 10% 50% 100% summer 4.2 7.3 20.8 64.2 winter 6.8 10.0 25.6 64.7 summer 4.9 8.1 22.3 63.1 winter 7.5 10.4 26.5 65.1 Table VII: Voltage deviations in%, charging between 6.00 - 8.00 p.m. Charging during the day is also an option. Table VIII and Table IX show the results. The impact on the distribution grid is high for both the power losses and the voltage deviations. But charging during the evening peak equals more or less the charging during the day. Of course, this is not quick charging with high power during the day, because the period of charging is still 4 hours. 6 scenario season 0% low scenario penetration of PHEV 10% 50% Kristien Clement received the M.S. degree in electromechanical engineering in 2004 with specialization Energy. Currently, she is working toward her Ph.D in electrotechnical engineering at the K.U.Leuven division ELECTA. Her research interests include hybrid and electric vehicles. 100% summer 2.6 3.2 8.5 30.9 winter 3.7 4.3 9.5 30.3 summer 2.9 3.5 8.7 29.9 4.1 4.8 10.3 30.3 winter Table VIII: Ratio of power losses to total power in %, charging between 1.00 - 2.00 p.m. high scenario scenario season penetration of PHEV 0% 10% 50% 3.8 6.5 19.3 64.2 summer 6.3 8.6 22.7 64.8 winter summer 4.1 6.9 19.9 64.5 high scenario winter 7.4 9.8 25.1 65.1 Table IX: Voltage deviations in %, charging between 1.00 - 2.00 p.m. low scenario V. CONCLUSION The charging of the PHEVs has a significant impact on the transmission and the distribution grid for each time of the day. For the distribution grid, the increase of the power losses and voltage deviations are too essential to ignore. This shows the importance of controlling the charging of the vehicles which will be part of further investigation. REFERENCES [1] [2] [3] [4] [5] [6] [7] [8] [9] [10] [11] [12] [13] S. Logghe, B. Van Herbruggen, B. Van Zeebroeck, Emissions of road traffic in Belgium, Transport & Mobility Leuven, January 2006. Commission Energy 2030, Belgium’s energy challenges towards 2030, preliminary report, November 2006. International Energy Agency, Energy Technology Perspectives, Scenarios and strategies to 2050, chapter 5, France, 2006. A. Raskin, S. Shah, The emerge of hybrid electric vehicles, AllianceBernstein, 2006. M. Anderman., The challenge to fulfil electrical power requirements of advanced vehicles, Journal of Power Sources, 127(2004), pp 2-7. P. Denholm, W. Short, An Evaluation of Utility System Impacts and Benefits of Optimally Dispatched Plug-In Hybrid Electric Vehicles, Technical Report, October 2006. J. Van Mierlo., Simulation software for comparison and design of electric, hybrid electric and internal combustion vehicles with respect to energy, emissions and performances, Phd, Vrije Universiteit Brussel, June 2000. Clement K., Van Reusel K., Driesen J., ‘ The consumption of electrical energy of plug-in hybrid electric vehicles in Belgium’" EET-European McKinsey, Drive, The future of automotive power, 2006. http://www.greencarcongress.com/2006/02/hymotion_unveil.html DaimlerChrysler, Overview of DC ZEV activities, ZEV Technology Symposium, September 2006. SWOV, nationaal wetenschappelijk Instituut voor verkeersveiligheid, http://www.swov.nl/nl/research/kennisbank/inhoud/90_gegevensbronne n/inhoud/gegevens_4.htm, last visited at 28 October 2007. Haesen E., Driesen J., Belmans R.:’A long-term multi-objective planning tool for distributed energy resources,’IEEE PES Power Systems Conference & Exposition , Atlanta, Georgia, USA, Oct.29-Nov.1, 2006; pp. 741-747. 100% Edwin Haesen (S’05) received his M.Sc. degree in electrical engineering at the KU Leuven in 2004. For his Master Thesis on “Technical Aspects of Congestion Management” he received the European Talent Award for Innovative Energy Systems 2005. He is currently pursuing a Ph.D. at the KU Leuven as a research assistant at the division ESAT-ELECTA. His research interests are in the domain of power system analysis and distributed generation. Johan Driesen (S’93–M’97) was born in Belgium in 1973. He received the M.Sc. and Ph.D. degrees in electrical engineering from Katholieke Universiteit Leuven (K.U. Leuven), Leuven, Belgium, in 1996 and 2000 on the finite element solution of coupled thermal-electromagnetic problems and related applications in electrical machines and drives, microsystems, and power-quality issues. Currently, he is an Associate Professor with K.U. Leuven and teaches power electronics and drives. In 2000–2001, he was a Visiting Researcher with the Imperial College of Science, Technology and Medicine, London, U.K. In 2002, he was with the University of California, Berkeley. Currently, he conducts research on distributed generation, including renewable energy systems, power electronics and its applications (e.g., in drives and power quality).
