2014 Southeast Hay Convention Effect of Polymer-Coated Urea on Bermudagrass Forage Production Introduction
advertisement
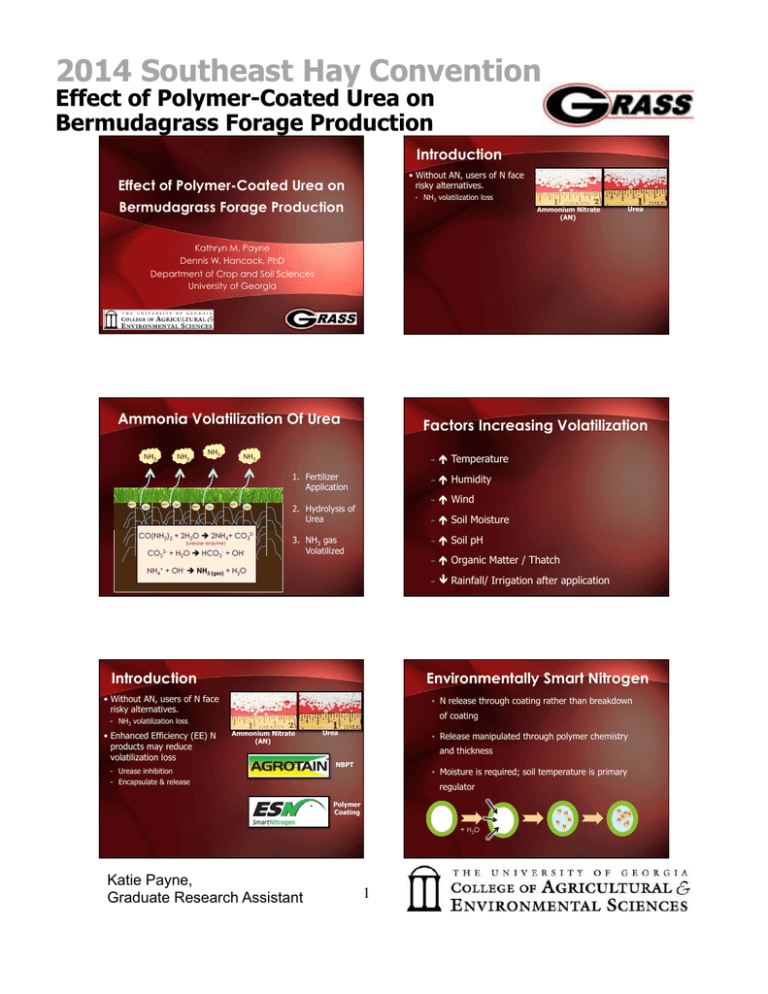
2014 Southeast Hay Convention Effect of Polymer-Coated Urea on Bermudagrass Forage Production Introduction • Without AN, users of N face risky alternatives. Effect of Polymer-Coated Urea on - NH3 volatilization loss Bermudagrass Forage Production Urea Ammonium Nitrate (AN) Kathryn M. Payne Dennis W. Hancock, PhD Department of Crop and Soil Sciences University of Georgia Ammonia Volatilization Of Urea Factors Increasing Volatilization – é Temperature 1. Fertilizer Application – é Humidity – é Wind 2. Hydrolysis of Urea CO(NH2)2 + 2H2O è 2NH4+ CO32(urease enzyme) CO32- + H2O è HCO3- + OH- – é Soil Moisture – é Soil pH 3. NH3 gas Volatilized – é Organic Matter / Thatch NH4+ + OH- è NH3 (gas) + H2O – ê Rainfall/ Irrigation after application Introduction Environmentally Smart Nitrogen • Without AN, users of N face risky alternatives. • N release through coating rather than breakdown of coating - NH3 volatilization loss • Enhanced Efficiency (EE) N products may reduce volatilization loss Ammonium Nitrate (AN) - Urease inhibition - Encapsulate & release Urea • Release manipulated through polymer chemistry and thickness NBPT • Moisture is required; soil temperature is primary regulator Polymer Coating N N N + H2 O Katie Payne, Graduate Research Assistant 1 N N N N N N 2014 Southeast Hay Convention Effect of Polymer-Coated Urea on Bermudagrass Forage Production Goal and Objectives Introduction • Without AN, users of N face risky alternatives. To evaluate the potential of ESN:Urea Blends (0%, 50%, 75%, 100% ESN) in two split applications relative to AN or Urea split into four equal applications. - NH3 volatilization loss Urea Ammonium Nitrate (AN) • Enhanced Efficiency (EE) N products may reduce volatilization loss NBPT - Urease inhibition - Encapsulate & release - NBPT and ESN treated urea have reduced volatilization by 64 and 81%, respectively. (Connell et al., 2011) - ESN releases N too slowly and reduces yield compared to NBPT treated urea and conventional AN. Compare these ESN blends and conventional systems in terms of: Polymer Coating 2. Forage yield distribution within the growing season 3. Ammonia volatilization loss 4. Recovery of the total N fertilizer applied to the crop Treatments Compared Application Rate at: Green After After After After Apps up H1 H2 H3 H4 Total Rate Application Rate at: Green After After After After Apps up H1 H2 H3 H4 N Source --------------------- (lb of actual N acre-1) --------------------- AN Urea 0% ESN 50% ESN 75% ESN 100% ESN Check Treatments Compared 4 4 0 0 300 300 Application Rate at: Green After After After After Apps up H1 H2 H3 H4 4 4 2 75 75 150 75 75 0 75 75 150 75 75 0 Katie Payne, Graduate Research Assistant 75 75 75 75 75 75 75 75 Application Rate at: Green After After After After Apps up H1 H2 H3 H4 Total Rate Treatments Compared Total Rate N Source --------------------- (lb of actual N acre-1) --------------------- AN Urea 0% ESN 50% ESN 75% ESN 100% ESN Check Total Rate --------------------- (lb of actual N acre-1) --------------------- AN Urea 0% ESN 50% ESN 75% ESN 100% ESN Check N Source Urea 1. Total forage production per year Treatments Compared N Source Ammonium Nitrate 0 0 0 --------------------- (lb of actual N acre-1) --------------------- AN Urea 0% ESN 50% ESN 75% ESN 100% ESN Check 300 300 300 2 4 4 2 2 2 2 0 75 75 150 150 150 150 0 75 75 0 0 0 0 0 75 75 150 150 150 150 0 75 75 0 0 0 0 0 0 0 0 0 0 0 0 300 300 300 300 300 300 0 2014 Southeast Hay Convention Effect of Polymer-Coated Urea on Bermudagrass Forage Production Materials and Methods Materials and Methods • Sites: Two UGA Ag. Exp. Stations • Analyzed for nutritive quality at FEW lab * - Calhoun - Eatonton • Analyzed for nitrate conc. * • ‘Russell’ bermudagrass, 4 harvests - Colorimetric determination by nitration of salicylic acid (Cataldo et al., 1975). - Reported as (NO3-N) ion mg kg-1 in DM - 2010-12 - New locations each year • Experiment Design: RCB • N Recovery Calculation - 4 replications - Data analyzed by Proc Mixed in SAS N Removed (fertilized plot) – N Removed (control plot) N Application Rate • Plots harvested with a forage plot harvester to a height of 2.5 in * Data not shown - Samples dried, ground (1 mm) Materials and Methods Results and Discussion • Ammonia Volatilization Traps - 100 mL 0.1 M H2SO4 acid traps - Covered by pvc pipe enclosure for 7 days in the field • Analyzed for ammonium conc. - Extract colorimetrically analyzed for NH4 (Mulvaney, 1996) - Reported as NH4-N conc. (mg L-1) Weather Data • 2011 - Calhoun: drought throughout growing season - Eatonton: heavy rain in mid-season • 2012 - Average rainfall at both locations 200 Objectives Calhoun 2010 2011 2012 60 Yr Avg Compare these ESN blends and conventional systems in terms of: 150 100 1. Total forage production per year 50 Jan Feb Mar Apr May Jun Jul Aug Sep Oct Nov Dec 3. Ammonia volatilization loss Month 250 Ammonium Nitrate 2. Forage yield distribution within the growing season 0 Total Rainfall (mm) • 2010 - Rainfall below average at both locations Total Rainfall (mm) 250 Eatonton 4. Recovery of the total N fertilizer applied to the crop 2010 2011 2012 90 Yr Avg 200 Urea 150 100 50 0 Jan Feb Mar Apr May Jun Jul Aug Sep Oct Nov Dec Month Katie Payne, Graduate Research Assistant 3 2014 Southeast Hay Convention Effect of Polymer-Coated Urea on Bermudagrass Forage Production Forage Yield (lb acre-1 yr-1) N Treatment Effects on Total Forage Production Per Year Objectives Compare these ESN blends and conventional systems in terms of: 14000 a 11500 a 1. Total forage production per year ab b b b Ammonium Nitrate 2. Forage yield distribution within the growing season 3. Ammonia volatilization loss 9000 4. Recovery of the total N fertilizer applied to the crop Urea 6500 c 4000 AN, 4 apps Urea, 4 apps 0% ESN: 50% ESN: 75% ESN: 100% ESN: 100% Urea 50% Urea 25% Urea 0% Urea Columns followed by same letters are similar at P = 0.05 No N Control Treatment Forage Yield by Harvest – Eatonton 2010 2000 d e H1 d H2 d H3 H4 Harvest a 4. Recovery of the total N fertilizer applied to the crop Urea Columns followed by same letters are similar at P = 0.05 Ammonia Volatilization Loss Following Mid-Season Fertilization Objectives 60 Compare these ESN blends and conventional systems in terms of: a (mg L-1) NH4-N Conc. 50 1. Total forage production per year ab 40 Ammonium Nitrate 2. Forage yield distribution within the growing season 3. Ammonia volatilized after H2 fertilizer application 30 20 Ammonium Nitrate 2. Forage yield distribution within the growing season 3. Ammonia volatilization loss a 0 a a a a b 1. Total forage production per year Treatment a abc bc bc c a c ab ab bc ab c N SN N SN a S E ES E ck N e E A Ur 0% 50% 5% 00% he 7 1 C a b bc cd bcd Compare these ESN blends and conventional systems in terms of: (lb acre-1 yr-1) 4000 Objectives Forage Yield 6000 4. Recovery of the total N fertilizer applied to the crop bc c 10 Urea c c 0 Urea, 4 Apps 0% ESN: 50% ESN: 75% ESN: 100% ESN: 100% Urea 50% Urea 25% Urea 0% Urea No N Control Treatment Columns followed by same letters are similar at P = 0.05 Katie Payne, Graduate Research Assistant 4 2014 Southeast Hay Convention Effect of Polymer-Coated Urea on Bermudagrass Forage Production N Recovery (lb N removed lb N applied-1) Effect of Treatment on the Recovery of Applied N 0.500 0.450 0.400 0.350 0.300 0.250 0.200 0.150 0.100 0.050 - a ab abc Conclusions • Total yield of the 50 and 75% ESN blends were similar to that of AN. abc bc c • Throughout the growing season, 50 and 75% ESN blends achieved slow release of N without erratic forage distribution. • ESN blends reduced the amount of ammonia volatilization/trapped. AN, 4 apps Urea, 4 apps 0% ESN: 50% ESN: 100% Urea 50% Urea 75% ESN: 100% ESN: 25% Urea 0% Urea Treatment Columns followed by same letters are similar at P = 0.05 Conclusions Implications • Two equal split applications of a 50%:50% or • ESN blend applications split twice per season recovered similar amounts of applied N as conventional AN, applied four times. 75%:25% blend of ESN:Urea could provide an alternative to conventional AN recommendations. – Economic analyses should be conducted to assess the • The nutritive value of the ESN blends were generally similar to AN (data not shown). cost-effectiveness of this promising alternative. - Nitrate levels in ESN blends of 50 and 75% were lower than AN (data not shown). • Use of such blends reduces NH3 volatilization loss and increases the recovery of applied N, reducing potential environmental threats. Basic Cost Analysis Trt. QUESTIONS? net lb lb as $ as lb as $ as Yield Forage Forage trips $ trips Total N urea urea ESN ESN (lb/A/yr) Cost Value revenue 100 Urea x 300 300 4 100 Urea x 300 300 2 50 Urea: 300 150 50 ESN 25 Urea: 300 225 75 ESN 100 ESN 300 0 $210 0 $- 4 $20 $530 9461 0.0560 $1,324.50 $794.50 $210 0 $- 2 $10 $520 9483 0.0548 $1,327.63 $807.63 $105 150 $115.50 2 $10 $530.50 10426 0.0509 $1,459.63 $929.13 $157 75 $57.75 2 $10 $525.25 10035 0.0523 $1,404.88 $879.63 $- 300 $231 2 $10 9606 0.0563 $1,344.88 $803.88 $541 Values Determined Assuming Urea Price: $0.70/ lb N ESN Price: $0.77/ lb N Forage Cost: Total Cost / Yield 50 lb DM @ $7/bale: $0.14/ lb DM 1 trip across the field: $5 Forage Value: Yield x $0.14/lb DM Total Cost: $300 + fert $ + trip $ Net Revenue: Forage Value – Total Cost Katie Payne, Graduate Research Assistant 5 2014 Southeast Hay Convention Effect of Polymer-Coated Urea on Bermudagrass Forage Production Mean TDN Concentration Across All Years, Locations, And Harvests Total Digestible Nutrients Relative Forage QualitY Mean RFQ Across All Years, Locations, And Harvests 94 a ab 90 ab a ab b 88 86 84 82 80 495 c AN, 4 apps Urea, 4 0 ESN: 50 ESN: 75 ESN: 100 ESN: Check apps 100 Urea 50 Urea 25 Urea 0 Urea a bc 490 (g kg-1) (unitless index) 92 500 bc 475 470 d 465 460 AN, 4 apps Urea, 4 apps 0 ESN: 100 ESN a ab (mg kg-1) bc Nitrate (NO3-N) Conc. Crude Protein (g kg-1) c 125 120 115 110 d 105 100 Urea 0% ESN 50% ESN 75% ESN 100% Check ESN Treatment Number of Obs. Instances 10 9 8 7 6 5 4 3 2 1 0 >2500 >4500 Urea, 4 0 ESN: 50 ESN: 75 ESN: 100 ESN: Check apps 100 Urea 50 Urea 25 Urea 0 Urea Treatment Katie Payne, Graduate Research Assistant b 2000 c 1500 Check 6 bc c d 1000 e 500 AN, 4 apps Urea, 4 0 ESN: 50 ESN: 75 ESN: 100 ESN: Check apps 100 Urea 50 Urea 25 Urea 0 Urea Treatment Incidence Of Risky No3-N Conc. Observed Over 24 Harvests AN, 4 apps 100 ESN: Urea a 2500 0 AN 75 ESN: 25 Urea Mean No3-N Conc. Across all Years, Locations, And Harvests 3000 c 130 50 ESN: 50 Urea Treatment a 135 c 480 Effect of N Treatment on CP averaged over all years, locations, and harvests 140 ab 485 Treatment 145 abc
