Using LiDAR to study alpine watersheds
advertisement
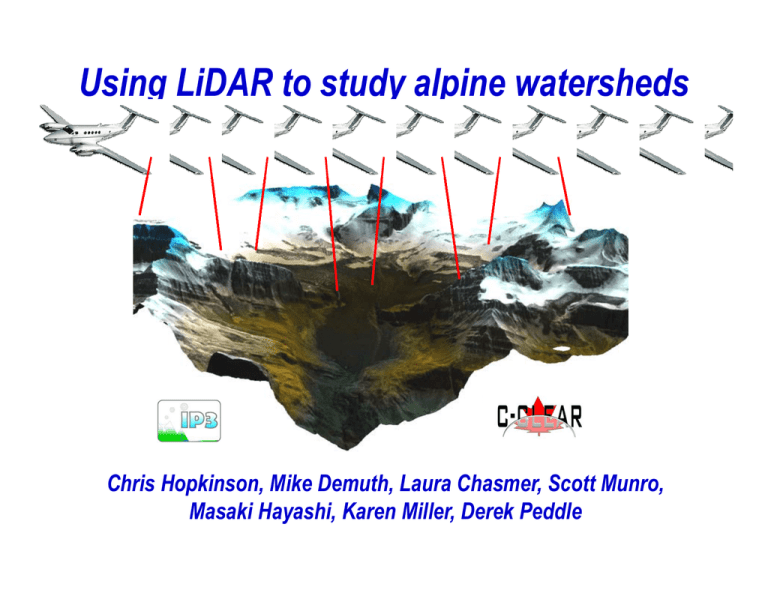
Using LiDAR to study alpine watersheds Chris Hopkinson, Mike Demuth, Laura Chasmer, Scott Munro, Masaki Hayashi, Karen Miller, Derek Peddle Light Detection And Ranging r t LASER pulse emitted and reflection timed Measures distance from source to object r = (c x t) / 2 r = range c = speed of light t = time Pulse origin & vector To compute location (b) of point on ground need to know: a b = f (a,r,θ,ω) θ 1. position of pulse start (a) 2. laser pulse vector • • • Chris Hopkinson 2006 Range (r) Scan angle (θ) Sensor attitude (ω) r b Comparison of watershed attributes derived from three DEM sources Chris Hopkinson, Masaki Hayashi, Karen Miller, Derek Peddle To generate DEMs from three typical sources: • BC TRIM • Softcopy aerial photogrammetry • Airborne lidar Compare derived GIS watershed attributes TRIM contour data Stereo photo point data Lidar shaded relief Watershed extents LiDAR Photo TRIM Hypsometry Summary Elevations/hypsometry: • Photo / TRIM appear ‘stretched’- Orientation control • TRIM biased downwards - Watershed extent • Photo/TRIM overestimate alpine - Gulleys invisible Watershed extents: • Photo slightly larger than Lidar – Terrain variation • TRIM much greater than Lidar – Stream topology Stream network: • Topology problems with TRIM data – Contour spacing • Photo ok but imperfect topology – Shadows/forests • Lidar maps gulley water courses – Active illumination Variations in GIS glacial melt prediction with terrain resolution Chris Hopkinson, Laura Chasmer, Scott Munro, Michael N. Demuth Assess impact of DEM resolution on melt prediction: • Eight resolutions: 1 m to 1000 m • Half hour time step Compare: • Total melt • Temporal distribution Scale effects on Glacier DEM attributes Δ Diurnal melt rate with resolution 0.4 10 m 25 m 100 m 250 m 500 m 1000 m 0.3 Melt (mm/hr) 0.2 0.1 0 -0.1 -0.2 -0.3 5.00 Scale-based morphology variations impact timing of melt at each resolution 12.00 Time 19.00 Assessing glacier dynamics from multitemporal lidar imagery Chris Hopkinson & Michael N. Demuth Assess glacial / periglacial rates of downwasting & motion 4 lidar datasets: 2000, 02, 06, 07 Local context • Glacier wastage impacts water resources in western Canada • Several studies suggest that mean annual contribution: – Is significant (1% to 12%) – Depends on size of basin & glacier cover – Will reduce as glacier sizes diminish • Is wastage decreasing, leveling off or increasing? Observed glacial dynamics • Glacier area reduced by ~ 12% from 12.5 km2 to 11.0 km2 • Downwasting > 40 m in parts of the ablation zone, • Mean melt depth increased from 1.0 m p.a. (2000) to 1.6 m p.a. (2007) • Mean loss of glacial ice of 14.1 x 10⁶ m3 p.a. Glacial storage capacity reducing Observed glacial dynamics • Lateral moraine downwasting ~ 1.0 m p.a • Annual loss from moraines ranged from 3.7% to 4.8% • Ablation zone moulin motion ~ 6 m p.a. • Accumulation zone debris movement up to 15 m p.a. • Constricted icefall motion up to 20 m p.a. • Moraines moving up to 6 m p.a. laterally towards margins Moraine storage capacity increasing Summary • Peyto glacier is rapidly losing mass – Rate of loss still increasing through time – Accumulation zone rapidly transporting mass to ablation zone – Ablation zone stagnating • Glacial ice loss increasing at exponential rate as volume diminishes • Ice cored moraine loss increasing at logarithmic rate as storage capacity increases Ice cored moraine melt water production is increasing as glacier cover diminishes. Its contribution to the river water resource will become critical in the next few decades Hydrological models need to explicitly account for this increasingly important alpine flow component Thank you!
