19 Migration and Development Brief
advertisement
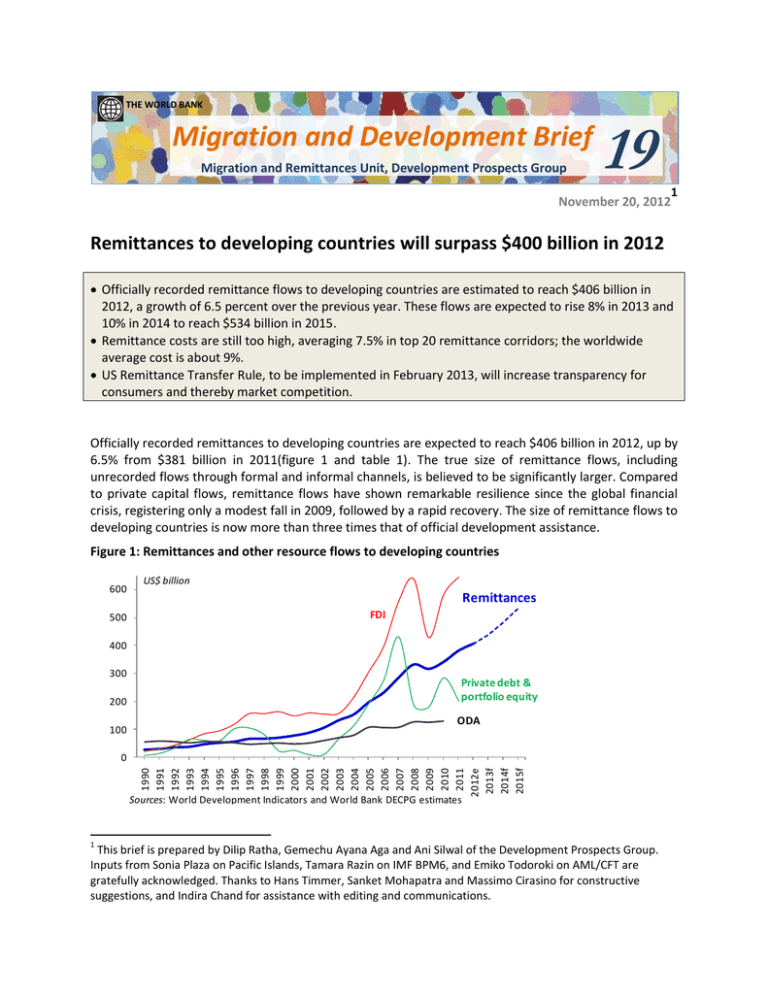
THE WORLD BANK Migration and Development Brief Migration and Remittances Unit, Development Prospects Group 19 1 November 20, 2012 Remittances to developing countries will surpass $400 billion in 2012 Officially recorded remittance flows to developing countries are estimated to reach $406 billion in 2012, a growth of 6.5 percent over the previous year. These flows are expected to rise 8% in 2013 and 10% in 2014 to reach $534 billion in 2015. Remittance costs are still too high, averaging 7.5% in top 20 remittance corridors; the worldwide average cost is about 9%. US Remittance Transfer Rule, to be implemented in February 2013, will increase transparency for consumers and thereby market competition. Officially recorded remittances to developing countries are expected to reach $406 billion in 2012, up by 6.5% from $381 billion in 2011(figure 1 and table 1). The true size of remittance flows, including unrecorded flows through formal and informal channels, is believed to be significantly larger. Compared to private capital flows, remittance flows have shown remarkable resilience since the global financial crisis, registering only a modest fall in 2009, followed by a rapid recovery. The size of remittance flows to developing countries is now more than three times that of official development assistance. Figure 1: Remittances and other resource flows to developing countries 600 500 US$ billion Remittances FDI 400 300 200 100 Private debt & portfolio equity ODA 1990 1991 1992 1993 1994 1995 1996 1997 1998 1999 2000 2001 2002 2003 2004 2005 2006 2007 2008 2009 2010 2011 2012e 2013f 2014f 2015f 0 Sources: World Development Indicators and World Bank DECPG estimates 1 This brief is prepared by Dilip Ratha, Gemechu Ayana Aga and Ani Silwal of the Development Prospects Group. Inputs from Sonia Plaza on Pacific Islands, Tamara Razin on IMF BPM6, and Emiko Todoroki on AML/CFT are gratefully acknowledged. Thanks to Hans Timmer, Sanket Mohapatra and Massimo Cirasino for constructive suggestions, and Indira Chand for assistance with editing and communications. Among the developing country regions, South Asia (SA) and Middle East and North African (MENA) saw the strongest growth, driven primarily by strong economic activity in the Gulf Cooperation Council (GCC) countries (table 1).2 Remittances to Egypt have surged since 2010, perhaps driven by increased support by migrants to their families in the face of political uncertainty or savings brought by returning migrants. Remittances to Latin America and Caribbean (LAC) were supported by a recovering economy and moderately improving labor market in the US but were moderated by a weak European economy. Countries in the Commonwealth of Independent States (CIS) neighboring Russia have also benefited from a booming Russian economy driven by high oil prices. Eastern Europe and Central Asian countries that send migrants to Western Europe have seen weak remittance flows due to weak labor markets in destination countries. Box 1: Top recipients of remittances among developing countries The top recipients (box figure 1) of remittances in 2012 are India ($70 billion), China ($66 billion), the Philippines 3 ($24 billion), Mexico ($24 billion), and Nigeria ($21 billion). As a percentage of GDP, the top recipients (box figure 2) of remittances in 2011 were Tajikistan (47%), Liberia (31%), Kyrgyz Republic (29%), Lesotho (27%), Moldova (23%), Nepal (22%), and Samoa (21%). Box figure 1: Top 10 recipients of migrant remittances Box figure 2: Top 10 recipients of migrant remittances as a share of GDP (US$ billion, 2012e) 70 (% of GDP, 2011) 66 47 31 24 24 21 18 14 14 9 29 27 23 22 21 21 18 18 7 Note: Remittance inflows and gross domestic product (GDP) in box figure 2 are for 2011, the latest year for which official GDP data is available for most countries. Source: Same as table 1. 2 Our estimate of remittance flows for the current year is based on available monthly and quarterly data released by Central Banks and the IMF Balance of Payments. We estimated growth for the remaining period of 2012 based on the year-to-date growth rate in 2012. For countries that have not released any data for 2012, we estimated remittance flows based on the forecast model described in Sanket Mohapatra and Dilip Ratha (2010), "Forecasting Migrant Remittances during the Global Financial Crisis," Migration Letters, 7(2):203-213. This model relies on migrant stocks, remittance inflows, and growth outlook of the economy to forecast remittance flows. GDP data used in the forecast comes from the World Bank’s Development Prospect Group and from IMF’s World Economic Outlook where data is not available from the former. The final estimate of remittances for 2012 is likely to change as countries release more complete data for 2012. 3 We have revised our methodology to estimate remittance flows to Nigeria and Kenya (see box 2). This revision has significantly increased the regional total for Sub-Saharan Africa. 2 The growth of remittances is expected to be stronger during 2013-15. We expect growth of flows to remain robust in regions that rely on remittance flows from the US, the GCC, and Russia. Increasingly harsh rhetoric and policies hostile towards migrants in many destination countries, especially Europe, however, could discourage the flow of migrants in the future and subsequently weaken remittance flows. The estimated growth of remittances in 2012 is slightly lower, and forecasts for 2013-15 higher, than the forecasts reported earlier this year in Migration and Development Brief 18. The revision reflects updated economic projections by the World Bank for major remittance source countries in Europe, the Gulf Cooperation Council (GCC) countries, Russia and the United States. Migrants appear to be more responsive to economic cycles than native workers The US is the largest recipient of migrants from developing countries as well as the largest sender of remittances. The US economy has resumed growth, although still modest, after shrinking in 2008 and 2009. Migrant employment in the US has picked up considerably – and faster than employment of native workers – since 2009 and has recovered to the pre-crisis level (figure 2).4 This recovery, however, has favored higher-skilled occupations in healthcare and technical services more than lower-skilled occupations in construction. Data on the number of housing starts show that although the construction sector has stabilized after bottoming out in 2009, it is still far lower than the pre-crisis level. Interestingly, native employment in the construction sector has fallen more than that for unskilled migrants, and has actually increased for naturalized foreign-born individuals. Migrants have responded to a shrinking construction sector by moving to other services and trade sectors. Naturalized citizens have been better able to make this change compared with native-born and foreign-born non-citizens, which includes undocumented migrants (figure 2). Figure 2: Employment of migrants in the US is recovering, particularly in higher-skilled sectors millions 24 millions 40% 30% 124 122 Native-born Foreign born, non-citizens Natives (left scale) 23 20% Foreign born, naturalized Migrants (right scale) 10% 120 22 0% 118 -10% 116 21 Jan-08 Aug-08 Mar-09 Oct-09 May-10 Dec-10 Jul-11 Feb-12 Sep-12 *3-month moving averages Source: Current Population Survey Construction Accomodation/food services Trade Professional/tech. services Total *Change in monthly average employment levels between Jan-Sep 2009 and Jan-Sep 2012 Source: US Current Population Survey Remittance flows to Mexico, which originate primarily from the US, shrank during July to September 2012 compared with the same period in 2011. The year-to-date growth for the JanuarySeptember was 0%, which we expect to continue through the end of 2012. This appears puzzling in the 4 Another sign of an improving labor market for higher skilled migrants in the US is the amount of time be fore annual quotas for H-1B visa are being filled-up. Employers can apply for these visas every year from April 1. The demand for these visas was very weak in 2009-11, taking between 7-10 months to be used up. The quotas for the most recent year, in contrast, were used up in less than 3 months. 3 context of improving labor market conditions in the US. A variety of factors could be contributing to this slowdown in flows. According to the Pew Hispanic Center, the net flow of migrants from Mexico to the US has come to a standstill.5 This may have happened due to tighter border controls and fewer construction jobs in the US. Also the gyrations of the peso/dollar exchange rate may have contributed to the recent fall in remittance flows to Mexico compared to the high levels seen a year ago (see also figure 6b below). Similarly, high unemployment rates in Europe have impacted outward remittance flows from the region. Migrants in Spain – a major destination of migrants – had an unemployment rate of 31.5% in 2011, much higher than 19.5% for native-born (OECD Migration Outlook 2012). A comparison of current employment levels to those in the first quarter of 2009 shows that migrant unemployment rates increased more than that of native-born in France, Greece, Italy, Spain and the UK (figure 3). In contrast, migrant employment rate rose faster than that of native-born in Germany (and also Australia, Canada and the US). Figure 3: Migrant employment is more cyclical than that of native-born Change in employment rate, 2009Q1 to 2011Q4, Percentage points 4.2 5 2.3 1.7 0.6 1.0 0.4 1.4 0.8 1.6 1.0 0 -0.7 -1.1 -1.9 -2.1 -1.2 -3.3 -5 Foreign-born Native-born -5.4 -6.3 -10 -11.1 -15 -14.3 Source: OECD International Migration Outlook 2012 Weak output and employment have dampened remittance outflows from major remittance senders in Europe such as the UK, Spain, and Italy (figure 4a). Poland, Romania, Bosnia and Herzegovina – major recipients of remittances from Western European countries – have also seen shrinking remittances (figure 4b). At the outset of the crisis, migrants kept sending money home by cutting down their own expenses. However, as the crisis continues to take its toll, they may be forced to reduce the amount sent home. In fact, anecdotal evidences show that workers with free mobility within the Euro zone, such as those from Romania and Poland, are returning home in larger numbers unlike workers from Africa or Latin America who prefer to stay for fear that they may not be able to return. Countries in MENA and SSA have also been affected by weak remittance flows from Europe. 5 Jeffrey Passel, D’Vera Cohn, and Ana Gonzalez-Barrera (2012). “Net Migration from Mexico Falls to Zero – and Perhaps Less.” Pew Hispanic Center. Washington, DC. 4 Figure 4: Weak remittance flows from Western Europe (a) Remittance outflows from Western Europe Year-on-year growth Outward remittances Year-on-year growth 40% Inward remittances 20% Italy 20% UK 0% Bosnia & Herz. 0% Poland -20% -20% -40% 2009 Q2 (b): Remittance inflows to Eastern Europe Spain 2010 Q2 2011 Q2 Source: IMF Balance of Payments 2012 Q2 Romania -40% -60% 2009 Q2 2010 Q2 2011 Q2 2012 Q2 Source: IMF Balance of Payments Robust oil prices have bolstered remittance flows from Russia A striking contrast to weak remittance outflows from Western Europe has been flows from Russia, which has benefited from elevated oil prices in the last few years. Figure 5 shows that remittance outflows from Russia have closely followed oil prices. The main beneficiaries of growing remittance outflows from Russia have been migrants from the CIS region. Remittances to Armenia, Georgia, Kyrgyz Republic, Moldova, and Tajikistan are estimated to have grown in 2012. This is a contrast to Eastern European countries such as Serbia, Albania, Kosovo, and Romania that have seen up to double-digit decline in remittance flows in 2012. Figure 5: Remittance flows from Russia have grown in tandem with oil prices $ billions Outward remittances 8 from Russia $/barrel 140 120 100 6 80 4 2 0 60 40 Crude oil price (right scale) 20 0 Strong oil prices have also impacted outward remittances from the GCC countries. Remittance inflows to South Asia in particular have increased significantly during 2012. 5 Exchange rates have helped flows to some countries, but hurt in others Exchange rate is a major factor that determines trends in remittance flows. An unexpected depreciation of the home currency can spur a surge in remittance flows via a “sale effect” that encourages migrants to remit home their savings to make large purchases such as land, house, and durable assets. Similarly, a strong home currency may encourage migrants to delay sending remittances until exchange rates are more favorable. This dynamic can be seen in the Philippines, whose appreciating currency has accompanied weak growth in remittances (figure 6a). In contrast to this, South Asian currencies have also depreciated significantly since mid-2011, followed by very high growth rates in remittance flows (figure 6b). As mentioned earlier, weak remittances to Mexico in July and August 2012 may in part be explained by the appreciating currency. Figure 6a: Appreciation of the Philippine Peso has put downward pressure on growth of remittances Percent Pesos per US$ 47 46 Growth of remittances (right) 45 44 43 42 Exchange rate (left) 12 Local currency per US$ (July 2010=100) 120 10 115 8 110 6 105 4 100 41 2 40 39 Feb-10 0 Aug-10 Feb-11 Aug-11 Feb-12 Figure 6b: Indian Rupee, Bangladeshi Taka and Mexican Peso against the US dollar Indian Rupee Mexican Peso Bangladeshi Taka 95 90 Aug-12 Jul-10 Jan-11 Jul-11 Jan-12 Jul-12 Box 2: Recent changes in compilation of remittances data In September 2012 the International Monetary Fund (IMF) began publishing the Balance of Payments (BoP) Statistics according to the sixth version of the compilation methodology that various international organizations agreed to in 2009.* According to this methodology, remittances data are captured in two items: compensation of employees and personal transfers. Compensation of employees refers to "the income of border, seasonal, and other short-term workers who are employed in an economy where they are not resident and of residents employed by nonresident entities." Personal transfers consist of "all current transfers in cash or in kind made or received by resident households to or from nonresident households." In the previous version of the methodology, remittances were captured in the following items: compensation of employees, workers' remittances, and migrants' transfers. The definition of compensation of employee in the new methodology is essentially similar to the one used previously. However, personal transfer, which replaces workers’ remittances, is broader in definition and not necessarily restricted to transfers made by migrants. The new definitions are expected to improve data on remittances by bringing them closer to the compilation methodology used by many countries. We will continue to publish remittances data using the older definitions until more countries adopt the new format. The IMF has continued to publish data using the old methodology for most countries. A comparison of remittances data between the two formats shows that although differences exist, they are minor in most cases. Central banks of some countries, such as India, have also been publishing data in both the new and the old formats in their website. More countries will begin reporting BoP data in BPM6 format. In parallel to this, we have revised our methodology to estimate remittances for Kenya and Nigeria. In the past, data on Kenya’s remittances reported in the IMF BoP statistics were significantly smaller than data cited 6 by government officials. We currently report the data provided by the IMF BoP. By contrast, in the past Nigeria data reported in the IMF BoP showed a significant upward revision, raising questions as to the definition used; to maintain consistency with the previous data series, we estimated remittances to Nigeria by applying the growth rate of the new data series to the old data series. For both countries, we now use data from the IMF BoP Statistics. Remittances data for Nigeria are the same in BPM6 and BPM5. This change effectively doubles the level of remittances received by Nigeria, making it the fifth largest recipient among developing countries. There are several countries (notably Ghana) where data reported in IMF BoP statistics are still grossly underestimated. *Source: International Transactions in Remittances: Guide for Compilers and Users, International Monetary Fund 2009. Trends in remittance cost in the top 20 remittance corridors: Still high The cost of sending remittance is a key driver of remittance flows. Consequently, reducing remittance cost has been identified as a key policy objective to facilitate these flows. In 2008, the G8 (and later in 2011 the G20) countries committed to reduce the global average remittance cost by 5 percentage points in 5 years. The unweighted average remittance cost, based on World Bank’s Remittance Prices Worldwide (RPW)6 database, for the top 20 largest bilateral remittance corridors has declined from 8.6% in 2008 to about 7.5% in the third quarter of 2012 (figure 7a). The average remittance cost, weighted by the size of the bilateral remittance flow, reveals a similar story. The global average remittance price (i.e., average based on all countries for which price data is available) has declined over the same period from 9.81% in 2008 to 8.96% in the third quarter of 2012.7 Sub-Saharan Africa is the most expensive region to send remittance to, with a transfer costing (in third quarter of 2012) about 12.4% of the amount transferred. This is almost twice the corresponding figure of 6.5% for South Asia. Figure 7a: Remittance cost for top 20 largest bilateral remittance corridors 10% Figure 7b: Remittance cost for selected source countries, 2012 Q3 20% 8% 15% 6% 10% 4% Unweighted 5% Weighted 2% 0% 0% 2008 2009-Q1 2009-Q3 2010-Q1 2010-Q3 2011-Q1 2011-Q3 2012-Q1 2012-Q3 Source: Remittance Prices Worldwide databse Source: Remittance Prices Worldwide databse 6 http://remittanceprices.worldbank.org/ Analysis of Trends in the Average Total Cost of Migrant Remittance Services: http://remittanceprices.worldbank.org/~/media/FPDKM/Remittances/Documents/RemittancePriceWorldwideAnalysis-Nov2012.pdf 7 7 The average cost, however, masks variation across countries. Figure 7b provides the average cost, weighted by bilateral remittance volume, of sending remittances from the top remittance source countries to their top five largest receiving countries in the third quarter of 2012.8 Russia is, by far, the cheapest source country with a weighted average remittance cost of 2%. In many large remittance source countries such as the GCC, the US and the UK, the average cost is around 5%. By contrast, Japan ranks among the highest cost corridors: As of the third quarter of 2012, the weighted average cost of sending remittance from Japan to its five top remittance receiving countries was about 17% of the remittance amount. Germany is the next most expensive country, among the top remittance source countries, with the transfer costs consuming, on average, about 14% of the remittance amount. Overall, with the global average cost of remittance standing at 8.96%, there is still a long way to go to meet the objective of reducing remittance cost by 5-percentage points by 2014. One of the main contributors to the high remittance cost has been regulatory uncertainty and hurdles that raise entry barriers and inhibited the introduction of cheaper technologies, such as mobile money transfers. On the other hand, upcoming regulations, such as the US remittance rule, have the potential to reduce remittance cost in the long-run. AML/CFT regulations are burdensome and discourage entry of new firms In February 2012, the Financial Action Task Force (FATF), which sets international standards on AntiMoney Laundering and Combating the Financing of Terrorism (AML/CFT) merged 40 Recommendations on AML and 9 Special Recommendations on CFT. The changes in the revised Recommendations are not extensive in the case of remittances. The revised FATF Recommendations place a risk-based approach and should help protect remittance channels from abuse while facilitating secure and efficient flows. In particular, Recommendation 14 on Money or Value Transfer Services (MVTS) requires countries to license or register MVTS providers and their agents.9 The revised Recommendation 16 on Wire Transfers now requires additional information even for USD/EUR 1,000 threshold, that financial institutions (including MVTS) should obtain (i) the name of the originator; (ii) the name of the beneficiary; and (iii) an account number or unique transaction reference number, and send this information through the payment chain. However, the information should be collected based on declaration by the customers, and there is no need to require an identification document to “verify” the information. This new aspect of the requirements should not pose a problem for financial institutions because almost all (if not all) already collect information about customers in order to payout remittances to the right beneficiaries. Countries could however, set the threshold below this amount and require an identification document below this threshold. In the end, FATF standards are minimum standards and countries can impose higher standards. Previously, only ordering and beneficiary financial institutions were required to take certain action in order to facilitate the identification and reporting of suspicious transactions. Now, 8 These values are calculated as follows. First, we take the top 15 remittance source countries based on estimates of 2011 bilateral remittance matrix. For each country, we take its top five remittance corridors for which remittance price data and bilateral remittance flow figures are available. We then average the remittance price across the five remittance receiving countries, weighted by their respective bilateral remittances volume. Because of limited bilateral flow or remittance price data, for Malaysia (Qatar), the average remittance cost is based on three (two) remittance corridors. 9 MVTS is defined as “financial services that involve the acceptance of cash, cheques, other monetary instruments or other stores of value and the payment of a corresponding sum in cash or other form to a beneficiary by means of a communication, message, transfer, or through a clearing network to which the MVTS provider belongs. Sometimes these services have ties to particular geographic regions and are described using a variety of specific terms, including hawala, hundi, and [fei-chen].” 8 intermediary financial institutions are required to ensure that all originator and beneficiary information that accompanies a wire transfer is retained with it and if not, take appropriate action. In the case of MVTS, the roles of intermediary financial institutions are not usually applicable since there is no intermediary financial institution. The revised Recommendation explicitly states that Recommendation 16 applies to MVTS providers, given the earlier confusion that this requirement was only applicable to banks. In addition, in the case of an MVTS provider that controls both the ordering and the beneficiary side of a wire transfer, the MVTS provider is required to file a suspicious transaction report in any country affected by the suspicious wire transfer, and make relevant transaction information available to the Financial Intelligence Unit of that country. This is a new requirement for MVTS providers who are the network operators. The promise of mobile remittances has yet to be fulfilled Although channeling international remittances through mobile phones has the promise of expanding access and lowering costs, this service has yet to take off in a substantial way. The use of mobile phones has skyrocketed worldwide from 0.7 billion in 2000 to 6.0 billion in 2011, of which 4.6 billion are being used in developing countries. Mobile phones have been used in the following ways to facilitate international remittances.10 Mobile cash-out services allow households to receive money in accounts linked to their mobile phones (mobile wallet) and subsequently use it to conduct mobile transactions or cash-out the money at an agent. Mobile cash-in services allow migrants to send money from their mobile wallet. Other branchless cash-out services allow migrants to send money to a cash card held by recipients, who can then withdraw funds at ATMs or make purchases with the card. As of early-2012, only 20% of 130 mobile banking operators worldwide offered international remittance services.11 Major players in this market include G-Cash and Smart in the Philippines, M-PESA in Kenya and Tanzania, and Digicel in Fiji, Samoa, and Tonga (see box 3). Traditional money transfer operators, such as Western Union and Moneygram, have also partnered with some of these providers to offer international remittance services via mobile phones. Cross-border mobile remittances have not taken off due to a variety of regulatory and operational challenges. AML/CFT and “know-your-client” requirements also exacerbate the regulatory hurdle for mobile money operators that raise cost and operational burden. Mobile remittances fall in the regulatory void between financial and telecom regulations, a reality which creates regulatory uncertainty for potential market entrants. Many central banks do not allow non-bank entities to conduct cash-in and cash-out services. Mobile remittances will not take off until central banks and telecom authorities come together to craft rules that facilitate branchless banking. International remittances via mobile phones will also not take off until there is an ecosystem of domestic services built around mobile payments.12 Kenya and the Philippines are ahead of the curve in fostering an ecosystem of mobile payment services. They may provide fertile ground for adoption of international remittance services via mobile phones, but most other countries are much further behind at this point. 10 http://data.worldbank.org/data-catalog/world-development-indicators/wdi-2012 "CGAP Landscape Study on International Remittances through Mobile Money," CGAP, February 2012. 12 This is not to suggest that a national payment system should be built around one specific technological solution. See “Developing a Comprehensive National Retail Payments Strategy”. World Bank, 2012. 11 9 Box 3: Remittances in the Pacific Islands The cost of sending remittances from Australia and New Zealand to the Pacific Islands, such as Fiji and Samoa, is high, nearly 12% (box table 1). In order to reduce these high costs, some initiatives were established including the introduction in 2009 of a website by Australia and New Zealand, www.sendmoneypacific.org, which allows individuals and remittance service companies to compare the cost of sending remittances via different channels. The use of ATM cards and mobile phones for remittances can lower remittance costs. Learning from the success of M-Pesa program in Kenya, Vodafone MPAiSA launched its first international remittances to allow mobile phone users in Fiji to receive money from relatives and friends in Australia and New Zealand. Digicel also allows customers in Australia and New Zealand to send remittances by mobile phone to Fiji, Tonga, and Samoa. Money on the phone can be used as a mobile wallet to buy food, pay bills, withdraw cash or send phone credit. Participation does not require having a bank account; it is enough to have a cell phone with a simcard. However, these initiatives have yet to show a measurable drop in the cost of sending remittances from Australia and New Zealand to Fiji and Samoa (box table 1). Box table 1: Average cost of sending US$200 From/To Fiji Samoa 2009-3Q 2010-3Q 2011-3Q 2012-3Q 2009-3Q 2010-3Q 2011-3Q 2012-3Q Australia $27.57 $28.97 $29.94 $25.26 $24.63 $27.732 $25.30 $23.83 New Zealand $19.31 $19.22 $22.25 $19.46 $20.96 $18.50 $18.22 $23.29 Source: Remittance Prices Worldwide The remittance landscape is changing with the introduction of innovative mobile money transfer and branchless banking technologies. However, the new mobile transfer operators are facing some challenges. Limited interoperability between ATMs and between mobile carriers in the Pacific Islands has hindered adoption of ATM to ATM initiatives. It is desirable that mobile services for international remittances are available with any provider. There is often a lack of clarity on whether regulations relating to mobile remittances are set by financial regulators or telecommunications regulators. At the minimum, it will be important to maintain liquid assets in accounts with a regulated bank so that sufficient cash is available to meet customer demand to cash-out their remittances. Cumbersome Know Your Customer requirements mandate that Identifying senders and verifying their identity is required for cross-border remittances via mobile phones. Regulators in Australia and New Zealand require a photo ID each time an international money transfer is made. Digicel uses biometric technology to collect identification of its clients in New Zealand. Under the AML/CTF Act, individual and business wanting to engage in remittance services are required to register with a government regulator. To reduce the opportunities for money laundering, the MTOs impose limits on transaction and account size to minimize the risk. There are also gaps in regulation regarding consumer protection including lost payments through faulty transmissions, fraudulent transactions or identity theft on the part of the mobile operator, agent, or other payment service provider. A more protected consumer base wil contribute to a better functioning of the remittances market. New US Remittance Transfer Rule aims to improve transparency Remittance transfer providers are generally subject to State laws and are required to register with the US Department of Treasury’s Financial Crimes Enforcement Network, but are not uniformly covered by Federal consumer protection laws. The new remittance rule aims to implement the consumer protections created by the Dodd-Frank Wall Street Reform and Consumer Protection Act for certain electronic transfers to foreign countries. 13 The new remittance rule, to go into effect on February 7, 13 The European Union (EU) has a broadly comparable rule to the US remittance rule, the Payment Service Directive (PSD) implemented in 2009. However, the PSD is primarily limited to transfers in EU member currencies and to intra-EU remittance transfers, although some countries (e.g. Italy) have extended the law to transactions to non-EU countries. The European Commission is studying the impact of the law on competition and entry barriers, and the need and feasibility of extending the law to payments in all currencies and international payments. 10 2013, is expected to increase transparency in pricing, competition and innovation in the remittance market not only in the US, but also in the rest of the world. The new remittance rule has three key elements: 14 (a) A remittance transfer provider needs to provide a the sender with a disclosure of key transaction information, such as exchange rate, taxes and fees imposed and the total amount to be collected by the recipient, before and at the time of payment. The final receipt should also contain information on the name and contact details of the recipient, the date the fund is available for collection and the rights of the sender regarding cancellation and refund and error resolutions. (b) The second key component of the law relates to sender’s cancellation and refund right. It allows senders to cancel the transfer within 30 minutes of making the payment and for recurring payments, such as pre-authorized payments, at least three business days before the scheduled date of transfer. (c) The third component of the law relates to error investigation and remedy. A remittance transfer provider is required to investigate and remedy errors arising from an incorrect amount paid by the sender, computational error, and incorrect amount received by the designated recipient; and also errors arising from late delivery, deposit to a wrong account and certain fraudulent pick-up of the fund. A remittance transfer provider is responsible for errors committed by its agents. The law provides for some exceptions. For example, under certain circumstances, remittance transfer providers are allowed to disclose an estimate, instead of the exact value, of the amount to be received by the recipient. This sweeping rule will have immense implications for consumers and remittance service providers. It benefits senders by increasing transparency and certainty in the market. It reduces deceptive pricing and enables senders to shop for cheaper deals. Therefore, it may increase competition, potentially reducing remittance costs in the long-run. In the short-run, however, it is likely to increase costs to remittance transfer providers for maintaining up-to-date information on exchange and tax rates of receiving countries and fees charged by third parties. The error resolution requirement may also expose remittance transfer providers to risks arising from certain fraudulent pick-ups. The cost can be significant for large sized transfers and since it may expose RSPs to litigations. Remittance dispensing agents may, as a result, resort to strict identification requirement, not always good for the poor who may lack access to these documents. Cancellation and refund rights may force remittance transfer providers to delay transfer until the cancellation period expires. 14 More information on the rule, the safe harbor countries list (related to the estimates provisions in the rule), a guide for small businesses and other resources are available at http://www.consumerfinance.gov/regulations/final-remittance-rule-amendment-regulation-e/. US Consumer Financial Protection Bureau (CFPB) Director Richard Cordray’s remarks on the remittance rule including an instructive powerpoint presentation are available at http://www.consumerfinance.gov/blog/remittance-rulesession/. Note that this rule applies to remittance transfer providers and covers a wider class of consume-toconsumer and consumer-to-business transfers than migrant remittances. Remittance transfers not provided in the normal course of business – e.g., fewer than 100 transactions each during the previous year and the current year – are not covered. Also remittances of $15 or less are excluded. 11 Table 1: Estimates and projections for remittance flows to developing countries 2009 2010 2011 2012e 2013f 2014f 2015f All developing countries East Asia and Pacific Europe and Central Asia Latin America and Caribbean Middle-East and North Africa South Asia Sub-Saharan Africa 316 85 37 57 34 75 28 341 95 37 58 41 82 29 381 106 41 62 43 97 31 406 114 41 64 47 109 31 438 123 45 68 50 118 33 482 136 51 75 53 130 36 534 152 58 84 56 144 39 LDCs (UN-classification) Low-income countries Middle income High income World 23 21 294 119 435 25 23 318 121 462 27 28 353 133 513 30 32 374 128 534 33 36 402 133 570 37 41 441 141 623 42 47 487 151 685 All developing countries East Asia and Pacific Europe and Central Asia Latin America and Caribbean Middle-East and North Africa South Asia Sub-Saharan Africa -4.8% 1.8% -19.4% -11.8% -6.2% 4.8% -6.7% 8.0% 10.9% 0.0% 0.9% 20.8% 9.5% 4.9% 11.7% 12.3% 13.1% 7.3% 6.3% 17.7% 6.8% 6.5% 7.2% -0.9% 2.9% 8.4% 12.5% 0.0% 7.9% 8.2% 9.6% 7.6% 5.5% 8.7% 6.2% 10.1% 10.5% 14.8% 10.3% 6.2% 9.9% 8.7% 10.7% 11.3% 13.1% 11.0% 6.8% 11.0% 9.2% LDCs (UN-classification) Low-income countries Middle income High income World 1.4% 3.4% -5.3% -10.8% -6.5% 4.5% 9.7% 7.9% 1.7% 6.3% 11.1% 17.8% 11.2% 9.2% 11.0% 10.9% 16.0% 5.8% -3.5% 3.9% 10.4% 11.9% 7.6% 3.8% 6.9% 11.9% 14.5% 9.7% 6.5% 9.3% 12.4% 14.1% 10.4% 7.1% 9.9% $ billions Growth rate (%) e= estimate; f=forecast Sources: World Bank staff calculation based on data from IMF Balance of Payments Statistics Yearbook 2011 and data releases from central banks, national statistical agencies, and World Bank country desks. See Migration and Development Brief 12 for the methodology for the forecasts. The Migration and Development Brief is prepared by the Migration and Remittances Unit of the World Bank’s Development Prospects Group. These briefs are intended to be informal briefing notes on migration, remittances, and development. The views expressed are those of the authors and may not be attributed to the World Bank Group. The latest data on remittances and other useful resources are available at http://www.worldbank.org/migration. Our blog on migration, “People Move”, can be accessed at http://blogs.worldbank.org/peoplemove. Contributions, feedback, and requests to be added to or dropped from the distribution list, may be sent to Dilip Ratha at dratha@worldbank.org. 12
