B.4.1.1 EMPRÉSTIMOS DE OUTRAS INSTITUIÇÕES FINANCEIRAS LOANS OF OTHER MONETARY FINANCIAL INSTITUTIONS
advertisement
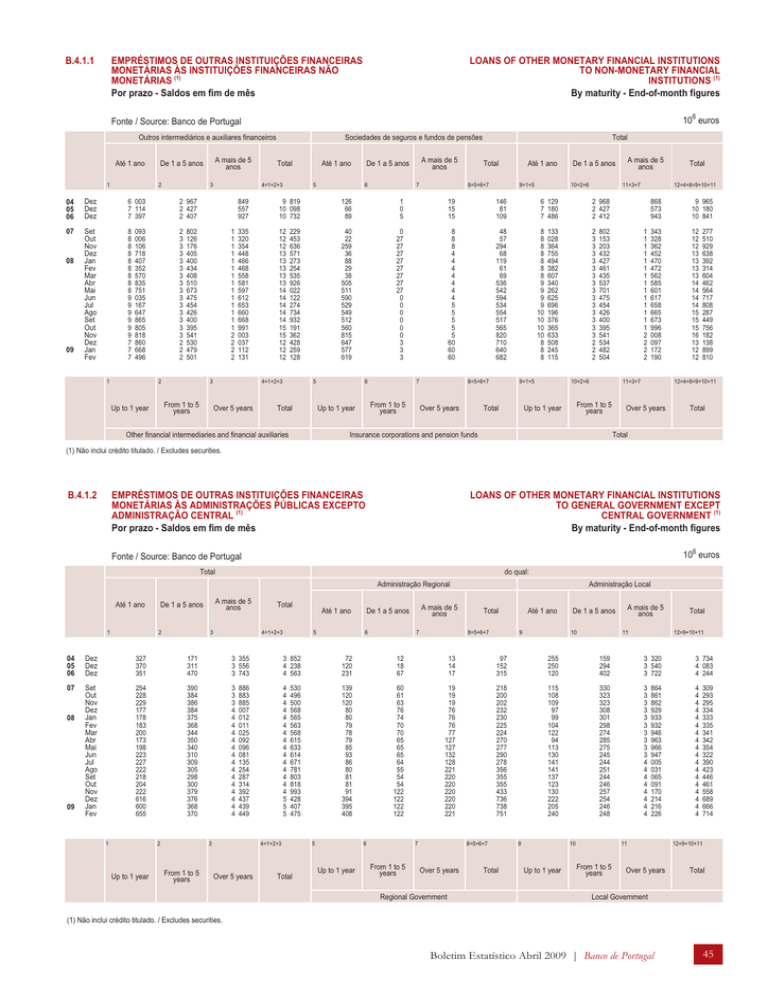
B.4.1.1 EMPRÉSTIMOS DE OUTRAS INSTITUIÇÕES FINANCEIRAS MONETÁRIAS ÀS INSTITUIÇÕES FINANCEIRAS NÃO MONETÁRIAS (1) Por prazo - Saldos em fim de mês LOANS OF OTHER MONETARY FINANCIAL INSTITUTIONS TO NON-MONETARY FINANCIAL INSTITUTIONS (1) By maturity - End-of-month figures 106 euros Fonte / Source: Banco de Portugal Outros intermediários e auxiliares financeiros Até 1 ano 1 2 3 04 05 06 Dez Dez Dez 6 003 7 114 7 397 2 967 2 427 2 407 07 Set Out Nov Dez Jan Fev Mar Abr Mai Jun Jul Ago Set Out Nov Dez Jan Fev 8 8 8 8 8 8 8 8 8 9 9 9 9 9 9 7 7 7 2 3 3 3 3 3 3 3 3 3 3 3 3 3 3 2 2 2 08 09 093 006 106 718 407 352 570 835 751 035 167 647 865 805 818 860 668 496 1 A mais de 5 anos De 1 a 5 anos 1 1 1 1 1 1 1 1 1 1 1 1 1 1 2 2 2 2 Até 1 ano 5 A mais de 5 anos De 1 a 5 anos 6 7 Total Total Até 1 ano 8=5+6+7 9=1+5 849 557 927 9 819 10 098 10 732 126 66 89 1 0 5 19 15 15 146 81 109 335 320 354 448 466 468 558 581 597 612 653 660 668 991 003 037 112 131 12 12 12 13 13 13 13 13 14 14 14 14 14 15 15 12 12 12 40 22 259 36 88 29 38 505 511 590 529 549 512 560 815 647 577 619 0 27 27 27 27 27 27 27 27 0 0 0 0 0 0 3 3 3 8 8 8 4 4 4 4 4 4 4 5 5 5 5 5 60 60 60 48 57 294 68 119 61 69 536 542 594 534 554 517 565 820 710 640 682 3 From 1 to 5 years Up to 1 year Total 4=1+2+3 802 126 176 405 400 434 408 510 673 475 454 426 400 395 541 530 479 501 2 Sociedades de seguros e fundos de pensões 229 453 636 571 273 254 535 926 022 122 274 734 932 191 362 428 259 128 4=1+2+3 Over 5 years 5 Total 6 From 1 to 5 years Up to 1 year Other financial intermediaries and financial auxiliaries 7 8=5+6+7 Over 5 years 10=2+6 6 129 7 180 7 486 8 8 8 8 8 8 8 9 9 9 9 10 10 10 10 8 8 8 Total 11=3+7 2 3 3 3 3 3 3 3 3 3 3 3 3 3 3 2 2 2 802 153 203 432 427 461 435 537 701 475 454 426 400 395 541 534 482 504 1 1 1 1 1 1 1 1 1 1 1 1 1 1 2 2 2 2 10=2+6 868 573 943 9 965 10 180 10 841 343 328 362 452 470 472 562 585 601 617 658 665 673 996 008 097 172 190 12 12 12 13 13 13 13 14 14 14 14 15 15 15 16 13 12 12 11=3+7 From 1 to 5 years Up to 1 year Insurance corporations and pension funds Total 12=4+8=9+10+11 2 968 2 427 2 412 133 028 364 755 494 382 607 340 262 625 696 196 376 365 633 508 245 115 9=1+5 A mais de 5 anos De 1 a 5 anos 277 510 929 638 392 314 604 462 564 717 808 287 449 756 182 138 899 810 12=4+8=9+10+11 Over 5 years Total Total (1) Não inclui crédito titulado. / Excludes securities. B.4.1.2 EMPRÉSTIMOS DE OUTRAS INSTITUIÇÕES FINANCEIRAS MONETÁRIAS ÀS ADMINISTRAÇÕES PÚBLICAS EXCEPTO ADMINISTRAÇÃO CENTRAL (1) Por prazo - Saldos em fim de mês LOANS OF OTHER MONETARY FINANCIAL INSTITUTIONS TO GENERAL GOVERNMENT EXCEPT CENTRAL GOVERNMENT (1) By maturity - End-of-month figures 106 euros Fonte / Source: Banco de Portugal Total do qual: Administração Regional Até 1 ano 1 A mais de 5 anos De 1 a 5 anos 2 3 Total 4=1+2+3 Até 1 ano 5 A mais de 5 anos De 1 a 5 anos 6 7 Administração Local Total 8=5+6+7 Até 1 ano 9 A mais de 5 anos De 1 a 5 anos 10 11 Total 12=9+10+11 04 05 06 Dez Dez Dez 327 370 351 171 311 470 3 355 3 556 3 743 3 852 4 238 4 563 72 120 231 12 18 67 13 14 17 97 152 315 255 250 120 159 294 402 3 320 3 540 3 722 3 734 4 083 4 244 07 Set Out Nov Dez Jan Fev Mar Abr Mai Jun Jul Ago Set Out Nov Dez Jan Fev 254 228 229 177 178 183 200 173 198 223 227 222 218 204 222 616 600 655 390 384 386 384 375 368 344 350 340 310 309 305 298 300 379 376 368 370 3 3 3 4 4 4 4 4 4 4 4 4 4 4 4 4 4 4 4 4 4 4 4 4 4 4 4 4 4 4 4 4 4 5 5 5 139 120 120 80 80 79 78 79 85 93 86 80 81 81 91 394 395 408 60 61 63 76 74 70 70 65 65 65 64 55 54 54 122 122 122 122 19 19 19 76 76 76 77 127 127 132 128 221 220 220 220 220 220 221 218 200 202 232 230 225 224 270 277 290 278 356 355 355 433 736 738 751 115 108 109 97 99 104 122 94 113 130 141 141 137 123 130 222 205 240 330 323 323 308 301 298 274 285 275 245 244 251 244 246 257 254 246 248 3 3 3 3 3 3 3 3 3 3 4 4 4 4 4 4 4 4 4 4 4 4 4 4 4 4 4 4 4 4 4 4 4 4 4 4 08 09 1 2 Up to 1 year 886 883 885 007 012 011 025 092 096 081 135 254 287 314 392 437 439 449 3 From 1 to 5 years 530 496 500 568 565 563 568 615 633 614 671 781 803 818 993 428 407 475 4=1+2+3 Over 5 years Total 5 6 Up to 1 year 7 From 1 to 5 years 8=5+6+7 Over 5 years Regional Government Total 9 10 Up to 1 year 864 861 862 929 933 932 946 963 966 947 005 031 065 091 170 214 216 226 11 From 1 to 5 years Over 5 years 309 293 295 334 333 335 341 342 354 322 390 423 446 461 558 689 666 714 12=9+10+11 Total Local Government (1) Não inclui crédito titulado. / Excludes securities. Boletim Estatístico Abril 2009 | Banco de Portugal 45 B.4.1.3 EMPRÉSTIMOS DE OUTRAS INSTITUIÇÕES FINANCEIRAS MONETÁRIAS ÀS SOCIEDADES NÃO FINANCEIRAS (1) Por prazo - Saldos em fim de mês LOANS OF OTHER MONETARY FINANCIAL INSTITUTIONS TO NON-FINANCIAL CORPORATIONS (1) By maturity - End-of-month figures 106 euros Fonte / Source: Banco de Portugal do qual: Até 1 ano De 1 a 5 anos 1 A mais de 5 anos 2 Total 3 4=1+2+3 04 05 06 Dez Dez Dez 38 734 38 509 37 754 21 598 21 503 23 316 22 558 26 678 30 786 07 Set Out Nov Dez Jan Fev Mar Abr Mai Jun Jul Ago Set Out Nov Dez Jan Fev 39 39 39 39 39 40 40 40 40 41 42 41 41 41 41 41 41 41 25 26 26 26 27 26 26 27 27 27 27 27 28 28 28 30 30 29 33 34 34 35 35 36 37 38 38 39 39 40 40 41 41 43 44 44 08 09 383 278 537 157 543 037 570 949 563 686 116 229 323 037 409 794 296 739 1 849 071 472 969 263 825 986 225 425 537 274 865 102 530 570 065 319 810 2 5 82 890 86 690 91 856 637 237 632 484 859 865 488 221 825 006 718 174 658 176 563 951 159 690 3 Up to 1 year Cobrança duvidosa 98 99 100 101 102 103 105 106 106 108 109 109 110 110 111 115 115 116 868 586 641 610 664 727 044 395 813 228 108 268 082 743 542 809 774 239 4=1+2+3 From 1 to 5 years 1 414 1 510 1 415 1 1 1 1 1 1 1 1 2 2 2 2 2 2 2 2 2 3 688 669 722 487 654 746 878 935 072 071 131 403 365 543 682 514 753 069 5 Over 5 years Non-performing loans Total of which: (1) Não inclui crédito titulado. / Excludes securities. B.4.1.4 LOANS OF OTHER MONETARY FINANCIAL INSTITUTIONS TO PRIVATE INDIVIDUALS (1) (to be continued) By purpose and maturity - End-of-month figures EMPRÉSTIMOS DE OUTRAS INSTITUIÇÕES FINANCEIRAS MONETÁRIAS A PARTICULARES (1) (continua) Por finalidade e prazo - Saldos em fim de mês 106 euros Fonte / Source: Banco de Portugal Habitação Consumo do qual: Até 1 ano 1 2 04 05 06 Dez Dez Dez 214 241 232 07 Set Out Nov Dez Jan Fev Mar Abr Mai Jun Jul Ago Set Out Nov Dez Jan Fev 218 220 227 235 213 203 216 215 135 133 141 130 136 117 111 99 113 113 08 09 De 1 a 5 anos 1 3 692 759 871 1 1 1 1 1 1 1 1 1 1 1 From 1 to 5 years Total 97 98 99 99 99 100 101 102 102 103 104 105 103 104 104 103 103 104 3 5 70 835 79 237 91 591 609 597 545 171 938 634 336 147 820 617 177 184 722 100 476 827 939 218 98 99 100 100 101 102 102 103 104 104 105 105 104 104 105 104 104 104 939 951 926 585 355 050 760 563 257 951 511 937 469 804 161 465 584 861 4=1+2+3 Over 5 years Até 1 ano Cobrança duvidosa 4=1+2+3 69 928 78 237 90 488 112 135 154 179 204 213 208 201 301 200 193 623 611 586 574 540 532 530 2 Up to 1 year A mais de 5 anos do qual: Total De 1 a 5 anos 6 A mais de 5 anos 7 8 9=6+7+8 46 Banco de Portugal | Boletim Estatístico Abril 2009 Cobrança duvidosa 10 1 072 1 177 1 139 1 908 2 024 2 575 3 079 2 993 3 356 4 072 4 390 5 448 9 059 9 406 11 379 454 292 369 1 1 1 1 1 1 1 1 1 1 1 1 1 1 1 1 1 1 2 3 3 3 3 3 3 3 3 3 3 3 3 3 3 3 3 3 3 3 3 3 3 3 3 3 3 3 3 4 4 4 4 4 4 4 6 6 6 6 6 6 7 7 7 7 7 7 7 7 7 7 7 7 12 12 13 13 13 13 14 14 14 14 14 15 15 15 15 15 15 15 410 432 535 505 524 569 590 613 633 657 678 691 721 755 799 759 787 861 228 245 284 264 295 315 369 377 404 433 485 510 534 560 603 570 623 665 5 934 057 076 251 228 274 312 331 391 373 353 469 515 511 504 665 646 658 6 Non-performing loans 281 294 778 794 778 779 917 922 935 936 945 075 112 131 151 072 041 023 7 Up to 1 year From 1 to 5 years 016 100 673 746 792 884 425 523 621 609 677 534 509 575 612 715 740 759 8 9=6+7+8 Over 5 years of which: Housing Total Total 231 452 527 790 799 937 654 776 947 918 976 078 136 217 268 452 427 440 10 Non-performing loans of which: Consumption B.4.1.4 LOANS OF OTHER MONETARY FINANCIAL INSTITUTIONS TO PRIVATE INDIVIDUALS(1) (continued) By purpose and maturity - End-of-month figures EMPRÉSTIMOS DE OUTRAS INSTITUIÇÕES FINANCEIRAS MONETÁRIAS A PARTICULARES(1) (continuação) Por finalidade e prazo - Saldos em fim de mês 106 euros Fonte / Source: Banco de Portugal Outros fins Total do qual: Até 1 ano De 1 a 5 anos 11 A mais de 5 anos 12 13 Total do qual: Até 1 ano Cobrança duvidosa 14=11+12+13 15 16 De 1 a 5 anos 17 A mais de 5 anos 18 Total Cobrança duvidosa 19=16+17+18=4+9+14 20=5+10+15 04 05 06 Dez Dez Dez 4 129 4 304 4 412 2 803 2 493 2 890 3 585 4 359 4 705 10 518 11 157 12 007 456 517 490 6 252 6 569 7 219 6 574 6 245 7 117 77 585 86 986 100 640 90 411 99 801 114 977 1 982 1 986 1 998 07 Set Out Nov Dez Jan Fev Mar Abr Mai Jun Jul Ago Set Out Nov Dez Jan Fev 4 4 4 4 4 4 4 4 4 4 4 4 4 4 4 4 4 4 2 2 2 2 2 2 2 2 2 2 2 2 2 2 2 2 2 2 5 5 5 5 5 5 5 5 5 5 5 5 5 5 5 5 5 5 12 12 12 12 12 12 12 12 12 12 12 12 12 12 12 12 12 12 547 561 548 438 458 505 523 533 557 560 571 601 630 614 634 548 593 637 7 7 7 8 8 8 8 8 8 8 8 8 8 8 8 8 8 8 7 7 7 7 7 7 7 7 7 7 7 7 7 7 7 7 7 7 108 110 111 111 112 113 113 114 115 116 117 117 116 116 117 116 116 117 123 125 127 127 128 128 129 130 131 132 133 133 132 132 132 132 132 132 2 2 2 2 2 2 2 2 2 2 2 2 2 2 3 2 3 3 08 09 652 577 548 650 584 568 561 597 569 686 645 588 621 584 541 759 407 389 11 729 734 747 784 865 839 700 681 633 717 736 769 755 678 676 666 649 605 12 Up to 1 year 302 319 410 469 504 525 180 216 196 240 201 174 210 207 183 232 207 273 13 From 1 to 5 years 682 630 705 902 954 931 441 494 399 642 582 531 586 470 401 656 263 268 14=11+12+13 Over 5 years 15 16 Non-performing loans Total 804 854 850 136 026 044 088 143 096 192 139 187 272 213 157 523 166 160 121 163 678 756 848 831 826 805 869 853 874 467 478 395 401 277 222 158 17 Up to 1 year 928 016 629 386 234 043 941 885 637 466 055 892 441 883 272 774 885 250 18 From 1 to 5 years 853 033 157 278 108 918 855 833 602 511 069 547 191 491 830 574 273 569 19=16+17+18=4+9+14 Over 5 years 185 238 367 207 277 390 482 523 594 650 734 801 885 930 036 877 002 163 20=5+10+15 Non-performing loans Total of which: of which: Other purposes Total (1) Não inclui crédito titulado e inclui crédito a emigrantes. / Excludes securities and includes credit to emigrants. B.4.1.5 EMPRÉSTIMOS DE OUTRAS INSTITUIÇÕES FINANCEIRAS MONETÁRIAS A PARTICULARES POR FINALIDADE(1) Estrutura e taxas de variação anual LOANS OF OTHER MONETARY FINANCIAL INSTITUTIONS TO PRIVATE INDIVIDUALS BY PURPOSE(1) Relative weight and annual growth rates Em percentagem / In percentages Fonte / Source: Banco de Portugal Taxas de variação anual Habitação 1 Consumo 2 (a) (a) Taxas de variação anual ajustadas de operações de titularização Outros fins 3 Total Habitação 4 5 Consumo Outros fins 6 7 Peso no total Total Habitação 8 9 Consumo 10 Outros fins 11 04 05 06 Dez Dez Dez 6.9 10.2 8.0 -2.4 4.4 13.7 9.3 6.7 10.5 6.2 9.2 8.8 10.5 11.1 9.9 0.3 1.9 9.7 9.3 7.2 10.6 9.2 9.8 9.9 78.3 79.4 79.7 10.0 9.4 9.9 11.6 11.2 10.4 07 Set Out Nov Dez Jan Fev Mar Abr Mai Jun Jul Ago Set Out Nov Dez Jan Fev 9.6 9.7 9.6 9.9 9.9 9.8 9.3 9.3 8.8 8.4 9.1 8.3 5.8 5.0 4.4 4.1 3.4 3.0 13.5 14.5 15.2 14.3 12.2 13.0 13.2 12.7 13.3 12.4 11.9 12.3 12.3 10.8 10.2 9.1 8.8 7.8 9.6 8.5 8.0 9.1 10.6 10.4 10.0 10.6 7.9 9.2 7.7 5.8 5.3 4.8 3.5 3.1 -0.6 -1.1 10.0 10.0 10.0 10.2 10.2 10.2 9.8 9.8 9.2 8.9 9.3 8.5 6.4 5.6 4.9 4.5 3.6 3.1 8.8 8.8 8.6 8.5 8.4 8.3 7.8 7.7 7.3 7.1 6.7 6.2 5.8 5.2 4.8 4.3 3.8 3.5 12.3 13.3 14.1 13.7 11.6 12.4 12.7 12.2 12.9 12.0 11.6 12.0 12.0 10.6 10.0 8.9 8.6 7.7 9.6 8.1 8.0 9.1 10.6 10.4 10.0 10.6 7.9 9.1 7.7 5.8 5.3 4.8 3.5 3.0 -0.6 -1.1 9.2 9.1 9.0 9.0 8.9 8.9 8.5 8.4 7.9 7.8 7.3 6.7 6.3 5.7 5.2 4.6 3.9 3.5 79.9 79.9 79.4 79.0 79.1 79.2 79.1 79.2 79.2 79.2 79.3 79.3 79.0 79.1 79.2 78.8 79.1 79.1 9.9 10.0 10.6 10.8 10.8 10.8 11.3 11.3 11.4 11.3 11.3 11.3 11.5 11.5 11.5 11.7 11.7 11.6 10.2 10.1 10.0 10.1 10.1 10.0 9.6 9.5 9.4 9.5 9.5 9.4 9.5 9.4 9.3 9.5 9.3 9.3 08 09 1 2 Housing 3 Consumption Other purposes Annual growth rates (a) 4 5 Total 6 Housing 7 Consumption Other purposes 8 9 Total Annual growth rates(a) adjusted for securitisation operations 10 Housing Consumption 11 Other purposes Relative weight (1) Não inclui crédito titulado e inclui crédito a emigrantes. / Excludes securities and includes credit to emigrants. Boletim Estatístico Abril 2009 | Banco de Portugal 47 B.4.2.1 EMPRÉSTIMOS DE OUTRAS INSTITUIÇÕES FINANCEIRAS MONETÁRIAS A SOCIEDADES NÃO FINANCEIRAS(1) (continua) Por ramo de actividade - Saldos em fim de mês LOANS OF OTHER MONETARY FINANCIAL INSTITUTIONS TO NON-FINANCIAL CORPORATIONS(1) (to be continued) By branch of activity - End-of-month figures 106 euros Fonte / Source: Banco de Portugal Agricultura, produção animal, caça e silvicultura Pesca do qual: Total 1 do qual: Total Cobrança duvidosa 2 Indústrias extractivas do qual: Total Cobrança duvidosa 3 4 5 Produção e distribuição de electricidade, gás e água Indústrias transformadoras do qual: Total Cobrança duvidosa 6 Total Cobrança duvidosa 7 8 9 10 Dez Dez Dez 1 118 1 198 1 291 48 33 27 94 91 94 12 11 3 402 413 381 10 17 8 12 493 12 180 11 994 383 398 372 1 603 2 165 1 912 07 Set Out Nov Dez Jan Fev Mar Abr Mai Jun Jul Ago Set Out Nov Dez Jan Fev 1 1 1 1 1 1 1 1 1 1 1 1 1 1 1 1 1 1 31 28 29 16 20 19 21 21 20 21 23 23 21 22 24 22 27 28 83 83 80 81 87 91 89 93 100 103 99 100 105 119 115 138 142 155 5 4 4 2 3 3 4 4 4 3 3 4 4 4 4 3 4 5 390 389 401 396 406 407 406 410 413 431 428 430 441 433 448 474 461 467 9 9 9 8 8 9 10 10 9 8 8 10 10 11 11 12 15 17 12 12 12 12 12 13 13 12 13 13 13 13 13 13 13 14 14 14 419 368 369 327 377 379 390 394 411 417 414 417 401 442 462 448 453 508 2 2 2 2 2 2 2 2 2 2 2 2 2 2 3 3 3 3 08 09 1 2 3 4 Non-performing loans Total 5 Non-performing loans Total of which: 7 8 Non-performing loans Total of which: Agriculture, hunting and forestry B.4.2.1 6 780 730 738 803 868 071 015 996 079 200 402 366 494 541 678 459 504 862 Total of which: Fishing 3 3 3 3 2 2 4 2 2 2 2 2 2 6 6 2 2 2 2 23 24 10 Total Cobrança duvidosa 12 15 987 17 448 18 224 309 309 369 19 19 20 20 20 20 20 21 21 21 21 21 21 21 21 22 22 22 467 472 504 418 491 519 580 604 650 663 698 808 777 845 862 804 817 886 635 788 016 063 525 724 997 141 403 660 778 933 927 943 970 245 479 603 11 Non-performing loans of which: Mining and quarrying Total 11 270 254 280 172 221 251 326 469 535 641 624 814 844 936 022 260 275 316 9 Non-performing loans do qual: Cobrança duvidosa 04 05 06 443 485 521 522 538 571 607 635 653 671 736 761 783 806 838 853 812 831 Construção do qual: 12 Non-performing loans Total of which: of which: Production and distribution of electricity, gas and water Manufacturing Construction LOANS OF OTHER MONETARY FINANCIAL INSTITUTIONS TO NON-FINANCIAL CORPORATIONS(1) (continued) By branch of activity - End-of-month figures EMPRÉSTIMOS DE OUTRAS INSTITUIÇÕES FINANCEIRAS MONETÁRIAS A SOCIEDADES NÃO FINANCEIRAS(1) (continuação) Por ramo de actividade - Saldos em fim de mês 106 euros Fonte / Source: Banco de Portugal Comércio por grosso e a retalho, reparação de veículos automóveis, motociclos e de bens de uso pessoal e doméstico Alojamento e restauração (restaurantes e similares) do qual: Total 13 do qual: Total Cobrança duvidosa 14 Transportes, armazenagem e comunicações 15 do qual: Total Cobrança duvidosa 16 Actividades imobiliárias, alugueres e serviços prestados às empresas do qual: Total Cobrança duvidosa 17 18 Educação, saúde e outras actividades de serviços colectivos, sociais e pessoais do qual: Total Cobrança duvidosa 19 20 do qual: 21 22 14 121 13 509 14 077 328 334 311 2 361 2 537 2 800 50 79 65 5 896 5 061 5 076 29 30 39 25 936 29 136 32 735 197 261 185 2 880 2 954 3 270 47 35 33 07 Set Out Nov Dez Jan Fev Mar Abr Mai Jun Jul Ago Set Out Nov Dez Jan Fev 14 14 14 14 14 15 15 15 15 15 15 15 15 15 15 16 16 16 358 355 352 323 352 348 368 374 395 393 391 424 416 453 496 471 469 528 2 2 2 3 3 3 3 3 3 3 3 3 3 3 3 3 3 3 58 50 50 44 48 52 60 64 66 69 59 62 64 71 80 80 75 83 5 5 5 5 5 5 5 5 6 6 6 6 6 6 6 6 6 6 55 56 56 55 43 42 45 44 45 45 45 47 46 49 51 53 51 60 35 36 36 37 37 38 38 39 38 39 39 39 40 40 41 42 42 41 247 278 303 254 274 332 357 375 425 406 442 555 577 592 629 568 763 868 3 3 3 3 3 3 3 3 3 3 3 3 3 3 3 4 4 4 37 47 46 35 37 41 42 42 44 42 42 47 46 50 60 52 56 61 08 09 13 14 Total 15 Non-performing loans of which: Wholesale and retail trade, repair of motor vehicles, motorcycles and personal and household goods 16 Total 661 686 816 494 652 617 864 970 039 067 349 141 252 262 272 821 767 860 17 Non-performing loans 18 Total of which: Hotels and catering (restaurants and other) 48 19 Non-performing loans of which: Transport, storage and communications (1) Não inclui crédito titulado. / Excludes securities. Banco de Portugal | Boletim Estatístico Abril 2009 631 052 434 586 932 278 761 262 985 434 623 799 146 563 006 530 351 905 20 Total 400 384 411 549 404 469 552 621 672 795 755 793 862 822 890 078 085 122 21 Non-performing loans of which: Real estate, rental and supply of services to non-financial corporations 22 Total Cobrança duvidosa 23 Dez Dez Dez 962 969 988 064 104 133 137 234 279 322 332 318 333 356 420 777 782 806 Total Cobrança duvidosa 04 05 06 613 767 955 880 927 116 291 565 654 902 979 811 896 962 884 174 116 313 Total 24 82 890 86 690 91 856 98 99 100 101 102 103 105 106 106 108 109 109 110 110 111 115 115 116 868 586 641 610 664 727 044 395 813 227 107 268 082 743 542 809 774 239 23 Non-performing loans 1 414 1 510 1 415 1 1 1 1 1 1 1 1 2 2 2 2 2 2 2 2 2 3 24 Total Non-performing loans of which: Education, health and other community, social and personal service activities 688 669 722 487 654 746 878 935 072 071 131 403 364 542 682 514 753 069 of which: Total B.4.2.2 EMPRÉSTIMOS DE OUTRAS INSTITUIÇÕES FINANCEIRAS MONETÁRIAS A SOCIEDADES NÃO FINANCEIRAS DA INDÚSTRIA TRANSFORMADORA(1) Por ramo de actividade - Saldos em fim de mês LOANS OF OTHER MONETARY FINANCIAL INSTITUTIONS TO NON-FINANCIAL CORPORATIONS OF THE MANUFACTURING INDUSTRY(1) By branch of activity - End-of-month figures 106 euros Fonte / Source: Banco de Portugal Indústrias alimentares, das bebidas e do tabaco 1 Indústria têxtil 2 Indústria do couro e de produtos do couro Indústrias Fabricação FabricaFabricade pasta, de coque, ção de Indústrias de papel e produtos produtos ção de da cartão e químicos e artigos de petrolíferos madeira e seus refinados e de fibras borracha e da cortiça e artigos: sintéticas de matérias combustísuas obras edição e ou plásticas impressão vel nuclear artificiais 3 4 5 04 05 06 Dez Dez Dez 2 337 2 469 2 366 2 012 1 868 1 753 389 382 364 1000 1 063 1 055 07 Set Out Nov Dez Jan Fev Mar Abr Mai Jun Jul Ago Set Out Nov Dez Jan Fev 2 2 2 2 2 2 2 2 2 2 2 2 2 2 2 2 2 3 1 1 1 1 1 1 1 1 1 1 1 1 1 1 1 1 1 1 362 356 346 352 356 359 363 363 360 363 368 367 363 353 342 355 358 363 1 1 1 1 1 1 1 1 1 1 1 1 1 1 1 1 1 1 08 09 530 554 594 590 610 558 575 623 652 687 696 642 644 690 717 812 768 024 1 808 737 743 730 740 742 731 722 703 709 722 730 698 678 675 718 764 764 2 Food, beverages and tobacco 3 Textiles 4 101 109 127 126 143 164 170 177 164 161 182 164 180 180 191 222 218 220 6 7 8 Fabricação de outros produtos minerais não metálicos 9 Indústrias metalúrgicas de base e de produtos metálicos Fabricação Indústrias de Fabricação máquinas e de equipa- Fabricação transforde material madoras, de equipamento de não mentos não eléctrico e transporte especificaespecifide óptica das cados 10 11 12 13 14 Total 15=1+...+14 1 269 771 792 19 32 21 516 497 501 440 483 494 1 399 1 395 1 346 1 225 1 261 1 336 552 579 601 305 325 352 430 388 359 599 666 653 12 493 12 180 11 994 858 852 847 957 929 946 957 964 981 957 999 023 042 017 038 157 131 149 42 99 18 62 68 177 18 28 41 34 76 6 7 30 27 25 33 27 554 541 555 527 522 564 592 525 541 608 593 617 646 621 680 726 801 797 512 510 506 505 502 502 505 511 528 530 543 541 544 567 574 607 607 604 1 1 1 1 1 1 1 1 1 1 1 1 1 1 1 1 1 1 1 1 1 1 1 1 1 1 1 1 1 1 1 1 1 1 1 1 657 659 676 670 675 665 678 671 679 675 678 685 691 724 727 776 768 778 395 389 404 396 390 390 385 382 385 412 438 443 461 476 477 491 481 482 373 375 372 380 361 349 354 343 342 353 366 365 397 392 407 505 503 517 688 686 687 693 691 738 737 739 752 750 785 834 846 858 859 922 915 926 12 12 12 12 12 13 13 12 13 13 13 13 13 13 13 14 14 14 1 1 1 1 1 1 1 5 6 7 8 465 414 393 398 416 410 410 411 408 408 399 386 388 380 393 468 449 468 9 10 434 450 470 418 465 507 537 536 545 556 559 562 586 575 570 674 707 744 11 12 13 Polp, metal ManufacManufac- Manufac- Manufac- Base paper, and Manufacture of Manufac- Wood and paperboard industries Manufacture of ture of ture of ture of machinery and cork ture of coke, ture of industries refined chemical rubber other and manufacleather and industries and oil electrical articles products and articles and non-metalic equipment, and and articles thereof; leather ture of optical man-made plastic mineral non thereof products nuclear metal equipment publishing and fuel fibres materials products products elsewhere and printing classified 14 15=1+...+14 Manufacturing industries, non elsewhere classified Manufacture of transport material 780 730 738 803 868 071 015 996 079 200 402 366 494 541 678 459 504 862 Total (1) Não inclui crédito titulado. / Excludes securities. B.4.2.3 EMPRÉSTIMOS DE OUTRAS INSTITUIÇÕES FINANCEIRAS MONETÁRIAS A SOCIEDADES NÃO FINANCEIRAS POR RAMO DE ACTIVIDADE (1)* Estrutura e taxas de variação anual LOANS OF OTHER MONETARY FINANCIAL INSTITUTIONS TO NON-FINANCIAL CORPORATIONS BY BRANCH OF ACTIVITY(1) * Relative weight and annual growth rates Em percentagem / In percentages Fonte / Source: Banco de Portugal Taxas de variação anual Agricultura, produção animal, caça, silvicultura e pesca 1 (1.5%) Indústrias extractivas 2 (0.4%) Produção e distribuição de electricidade, gás e àgua Indústrias transformadoras 3 (13.0%) (a) 4 (2.1%) Construção Serviços 5 (19.9%) 6 Total ( 63.0%) 7 (100.0%) 04 05 06 Dez Dez Dez 5.0 4.6 8.1 -6.7 0.8 -6.5 -3.8 -2.9 -1.0 -2.0 37.9 -11.6 6.0 10.8 4.8 3.2 4.3 9.1 2.5 5.1 6.2 07 Set Out Nov Dez Jan Fev Mar Abr Mai Jun Jul Ago Set Out Nov Dez Jan Fev 10.3 16.0 16.8 16.0 18.2 21.1 22.2 21.6 22.2 20.5 22.5 23.8 24.1 23.0 22.4 22.2 18.3 17.7 1.5 4.0 7.4 4.3 5.1 5.5 5.4 6.1 6.8 11.7 8.5 10.1 13.2 11.5 12.0 13.6 7.6 8.7 4.6 7.2 5.9 7.7 7.5 8.1 6.0 5.8 5.2 5.8 6.8 7.0 6.5 7.2 8.3 8.0 7.7 7.0 -2.2 20.3 17.4 13.5 14.8 19.8 20.9 26.8 28.8 31.5 26.8 27.4 25.2 30.2 32.4 47.9 45.1 45.2 9.9 11.3 10.5 10.7 12.8 12.8 12.7 12.8 12.4 12.6 13.1 13.2 12.1 11.2 10.1 8.8 7.3 7.0 9.1 8.2 11.0 11.7 13.4 13.5 14.0 14.2 12.5 12.6 12.2 12.3 12.2 11.8 11.4 10.2 9.0 8.3 8.4 9.0 10.4 11.0 12.5 12.9 12.9 13.2 12.0 12.2 12.1 12.3 11.9 11.7 11.4 10.7 9.4 8.8 08 09 1 (1.5%) Agriculture, hunting, forestry and fishing 2 (0.4%) Mining and quarrying 3 (13.0%) 4 Manufacturing (2.1%) Production and distribution of electricity, gas and water 5 (19.9%) Construction 6 (63.0%) 7 Services (100.0%) Total Annual growth rates (a) (1) Não inclui crédito titulado./ Excludes securities. * Entre parêntesis é indicado o peso de cada ramo de actividade no total em termos de saldos em fim de mês (média do último ano). / The value between brackets refers to the relative weight of each branch of activity in terms of end-of-month stocks (previous year average). Boletim Estatístico Abril 2009 | Banco de Portugal 49 ASSETS DENOMINATED IN FOREIGN CURRENCY(1) OF OTHER MONETARY FINANCIAL INSTITUTIONS VIS-À-VIS NON-MONETARY SECTOR By institutional sector - End-of-month figures ACTIVOS EM MOEDA ESTRANGEIRA(1) DE OUTRAS INSTITUIÇÕES FINANCEIRAS MONETÁRIAS FACE AO SECTOR NÃO MONETÁRIO Por sector institucional - Saldos em fim de mês B.4.3 106 euros Fonte / Source: Banco de Portugal Sector institucional Sociedades não financeiras Instituições financeiras não monetárias Administrações Públicas 1 Empréstimos 2 Títulos excepto acções 3 4 Total Particulares(2) Total 5=3+4 6 7=1+2+5+6 04 05 06 Dez Dez Dez 1 064 873 748 0 0 0 971 1 105 983 6 32 129 978 1 137 1 112 96 85 63 2 138 2 096 1 923 07 Set Out Nov Dez Jan Fev Mar Abr Mai Jun Jul Ago Set Out Nov Dez Jan Fev 868 865 1 105 986 1 002 982 955 976 994 1 000 986 1 026 1 049 1 158 1 145 1 005 1 139 1 148 0 0 0 0 0 0 0 0 0 0 0 0 0 0 0 0 0 7 458 433 424 416 462 573 457 478 462 465 484 459 477 545 521 470 524 562 291 264 259 244 248 249 240 241 213 216 314 366 280 395 395 354 379 397 749 698 684 660 710 823 696 719 675 681 798 825 758 939 916 824 903 959 67 65 83 82 76 74 71 73 91 85 78 83 84 88 88 81 84 82 1 1 1 1 1 1 1 1 1 1 1 1 1 2 2 1 2 2 08 09 1 2 3 4 6 Securities other than shares Loans General Government Non-monetary financial institutions 5=3+4 Total 684 627 871 727 788 879 723 768 760 766 862 934 891 185 149 910 126 195 7=1+2+5+6 Private individuals(2) Total Non-financial corporations Institutional sector (1) Até Janeiro de 2002 corresponde a moedas que não escudos e euros, a partir desta data, reflecte os saldos denominados em moedas que não euros./ Up to January 2002 corresponds to currencies other than escudos or euros, afterwards reflects balances denominated in currencies other than euros. (2) Inclui emigrantes. / Includes emigrants. B.4.4 EMPRÉSTIMOS DE OUTRAS INSTITUIÇÕES FINANCEIRAS MONETÁRIAS A SOCIEDADES NÃO FINANCEIRAS E PARTICULARES (1) (2) LOANS OF OTHER MONETARY FINANCIAL INSTITUTIONS TO NON-FINANCIAL CORPORATIONS AND TO PRIVATE INDIVIDUALS(1) (2) Por distrito / região autónoma - Saldos em fim de ano By administrative region - End-of-year figures 106 euros Fonte / Source: Banco de Portugal Aveiro Beja 1 04 05 06 07 08 Dez Dez Dez Dez Dez Braga 2 8 8 9 10 11 3 077 848 664 536 216 1 1 1 1 1 Castelo Branco Bragança 4 167 334 439 705 876 8 9 10 11 12 580 540 589 740 749 Coimbra 5 839 969 1 125 1 264 1 314 6 1 1 2 2 2 664 871 165 360 364 Évora 7 4 4 5 6 6 Faro Guarda 8 492 861 530 049 258 1 2 2 2 2 Leiria 9 842 076 377 656 828 5 6 7 8 9 299 141 313 746 435 Lisboa 10 1 1 1 1 1 11 059 157 254 413 470 6 6 7 8 8 039 774 478 400 957 Porto 13 04 05 06 07 08 Dez Dez Dez Dez Dez Santarém 14 28 29 33 36 38 844 950 749 479 535 15 4 5 5 6 6 545 088 700 493 806 Viana do Castelo Setúbal 16 10 11 13 14 14 907 574 089 206 943 Vila Real 784 996 192 528 864 18 Açores 1 1 1 2 2 596 767 960 184 307 19 2 3 3 4 4 984 419 833 369 853 Madeira 335 013 447 065 446 1 1 1 1 956 057 160 260 352 Total Off-shore 20 2 3 3 4 4 948 344 929 978 816 do qual / of which: Off-shore 17 1 1 2 2 2 Viseu 12 74 79 85 94 105 do qual / of which: Portalegre 21 0 0 0 0 0 22 5 5 6 7 7 344 714 839 455 996 23=1+...+19+21 818 689 969 1 237 1 036 173 186 206 228 248 301 491 834 888 383 ___________________________________________________________________________________________________________________________________________________________________________ (1) Não inclui crédito titulado. / Excludes securities. (2) Inclui emigrantes. / Includes emigrants. 50 Banco de Portugal | Boletim Estatístico Abril 2009
