Analysis of Tracer Dispersion During a Prescribed Forest Burn
advertisement
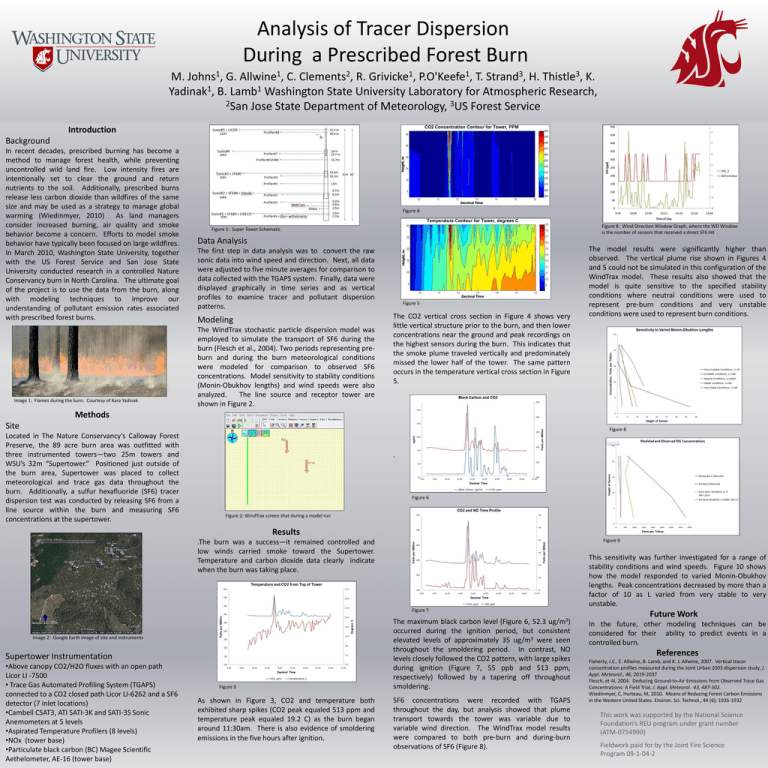
Analysis of Tracer Dispersion During a Prescribed Forest Burn 1 Johns , 1 Allwine , 2 Clements , 1 Grivicke , 1 P.O'Keefe , 3 Strand , 3 Thistle , M. G. C. R. T. H. K. 1 1 Yadinak , B. Lamb Washington State University Laboratory for Atmospheric Research, 2San Jose State Department of Meteorology, 3US Forest Service Introduction Background In recent decades, prescribed burning has become a method to manage forest health, while preventing uncontrolled wild land fire. Low intensity fires are intentionally set to clear the ground and return nutrients to the soil. Additionally, prescribed burns release less carbon dioxide than wildfires of the same size and may be used as a strategy to manage global warming (Wiedinmyer, 2010) As land managers consider increased burning, air quality and smoke behavior become a concern. Efforts to model smoke behavior have typically been focused on large wildfires. In March 2010, Washington State University, together with the US Forest Service and San Jose State University conducted research in a controlled Nature Conservancy burn in North Carolina. The ultimate goal of the project is to use the data from the burn, along with modeling techniques to improve our understanding of pollutant emission rates associated with prescribed forest burns. Image 1: Flames during the burn. Courtesy of Kara Yadinak Figure 4 Figure 8: Wind Direction Window Graph, where the WD Window is the number of sensors that received a direct SF6 Hit Figure 1: Super Tower Schematic Data Analysis The first step in data analysis was to convert the raw sonic data into wind speed and direction. Next, all data were adjusted to five minute averages for comparison to data collected with the TGAPS system. Finally, data were displayed graphically in time series and as vertical profiles to examine tracer and pollutant dispersion patterns. Modeling The WindTrax stochastic particle dispersion model was employed to simulate the transport of SF6 during the burn (Flesch et al., 2004). Two periods representing preburn and during the burn meteorological conditions were modeled for comparison to observed SF6 concentrations. Model sensitivity to stability conditions (Monin-Obukhov lengths) and wind speeds were also analyzed. The line source and receptor tower are shown in Figure 2. Figure 5 The CO2 vertical cross section in Figure 4 shows very little vertical structure prior to the burn, and then lower concentrations near the ground and peak recordings on the highest sensors during the burn. This indicates that the smoke plume traveled vertically and predominately missed the lower half of the tower. The same pattern occurs in the temperature vertical cross section in Figure 5. The model results were significantly higher than observed. The vertical plume rise shown in Figures 4 and 5 could not be simulated in this configuration of the WindTrax model. These results also showed that the model is quite sensitive to the specified stability conditions where neutral conditions were used to represent pre-burn conditions and very unstable conditions were used to represent burn conditions. Methods Site Figure 8 Located in The Nature Conservancy’s Calloway Forest Preserve, the 89 acre burn area was outfitted with three instrumented towers—two 25m towers and WSU’s 32m “Supertower.” Positioned just outside of the burn area, Supertower was placed to collect meteorological and trace gas data throughout the burn. Additionally, a sulfur hexafluoride (SF6) tracer dispersion test was conducted by releasing SF6 from a line source within the burn and measuring SF6 concentrations at the supertower. . Figure 6 Figure 2: WindTrax screen shot during a model run Results Figure 9 .The burn was a success—it remained controlled and low winds carried smoke toward the Supertower. Temperature and carbon dioxide data clearly indicate when the burn was taking place. Figure 7 Image 2: Google Earth image of site and instruments Supertower Instrumentation •Above canopy CO2/H2O fluxes with an open path Licor LI -7500 • Trace Gas Automated Profiling System (TGAPS) connected to a CO2 closed path Licor LI-6262 and a SF6 detector (7 inlet locations) •Cambell CSAT3, ATI SATI-3K and SATI-3S Sonic Anemometers at 5 levels •Aspirated Temperature Profilers (8 levels) •NOx (tower base) •Particulate black carbon (BC) Magee Scientific Aethelometer, AE-16 (tower base) Figure 3 As shown in Figure 3, CO2 and temperature both exhibited sharp spikes (CO2 peak equaled 513 ppm and temperature peak equaled 19.2 C) as the burn began around 11:30am. There is also evidence of smoldering emissions in the five hours after ignition. The maximum black carbon level (Figure 6, 52.3 ug/m3) occurred during the ignition period, but consistent elevated levels of approximately 35 ug/m3 were seen throughout the smoldering period. In contrast, NO levels closely followed the CO2 pattern, with large spikes during ignition (Figure 7, 55 ppb and 513 ppm, respectively) followed by a tapering off throughout smoldering. SF6 concentrations were recorded with TGAPS throughout the day, but analysis showed that plume transport towards the tower was variable due to variable wind direction. The WindTrax model results were compared to both pre-burn and during-burn observations of SF6 (Figure 8). This sensitivity was further investigated for a range of stability conditions and wind speeds. Figure 10 shows how the model responded to varied Monin-Obukhov lengths. Peak concentrations decreased by more than a factor of 10 as L varied from very stable to very unstable. Future Work In the future, other modeling techniques can be considered for their ability to predict events in a controlled burn. References Flaherty, J.E., E. Allwine, B. Lamb, and K. J. Allwine, 2007. Vertical tracer concentration profiles measured during the Joint Urban 2003 dispersion study, J. Appl. Meteorol., 46, 2019-2037 Flesch, et Al, 2004. Deducing Ground-to-Air Emissions from Observed Trace Gas Concentrations: A Field Trial, J. Appl. Meteorol. 43, 487-502. Wiedinmyer, C, Hurteau, M, 2010. Means of Reducing Forest Carbon Emissions in the Western United States. Environ. Sci. Technol., 44 (6): 1926-1932 This work was supported by the National Science Foundation’s REU program under grant number (ATM-0754990) Fieldwork paid for by the Joint Fire Science Program 09-1-04-2
