Emigration from and immigration to Croatia 2001 – 2011
advertisement
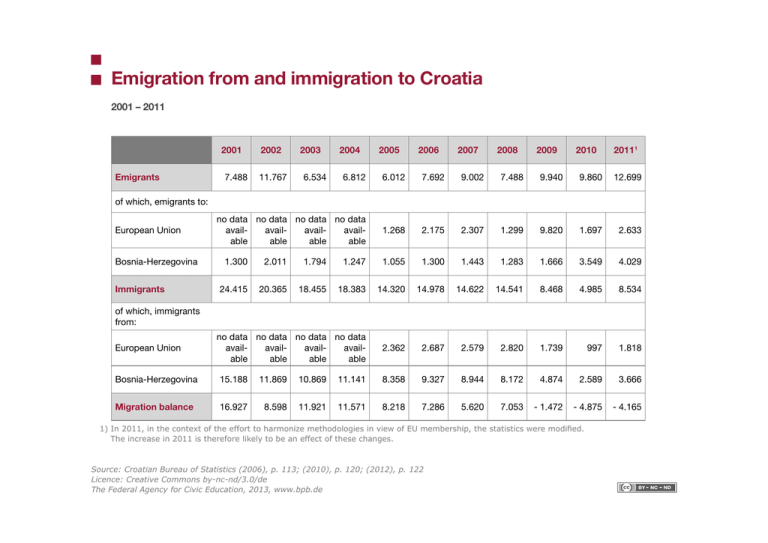
Emigration from and immigration to Croatia 2001 – 2011 2001 Emigrants 7.488 2002 11.767 2003 6.534 2004 2005 2006 2007 2008 2009 2010 20111 6.812 6.012 7.692 9.002 7.488 9.940 9.860 12.699 no data no data no data no data availavailavailavailable able able able 1.268 2.175 2.307 1.299 9.820 1.697 2.633 of which, emigrants to: European Union Bosnia-Herzegovina Immigrants 1.300 2.011 1.794 1.247 1.055 1.300 1.443 1.283 1.666 3.549 4.029 24.415 20.365 18.455 18.383 14.320 14.978 14.622 14.541 8.468 4.985 8.534 no data no data no data no data availavailavailavailable able able able 2.362 2.687 2.579 2.820 1.739 997 1.818 of which, immigrants from: European Union Bosnia-Herzegovina 15.188 11.869 10.869 11.141 8.358 9.327 8.944 8.172 4.874 2.589 3.666 Migration balance 16.927 8.598 11.921 11.571 8.218 7.286 5.620 7.053 - 1.472 - 4.875 - 4.165 1) In 2011, in the context of the effort to harmonize methodologies in view of EU membership, the statistics were modified. The increase in 2011 is therefore likely to be an effect of these changes. Source: Croatian Bureau of Statistics (2006), p. 113; (2010), p. 120; (2012), p. 122 Licence: Creative Commons by-nc-nd/3.0/de The Federal Agency for Civic Education, 2013, www.bpb.de


