Document 11874989
advertisement
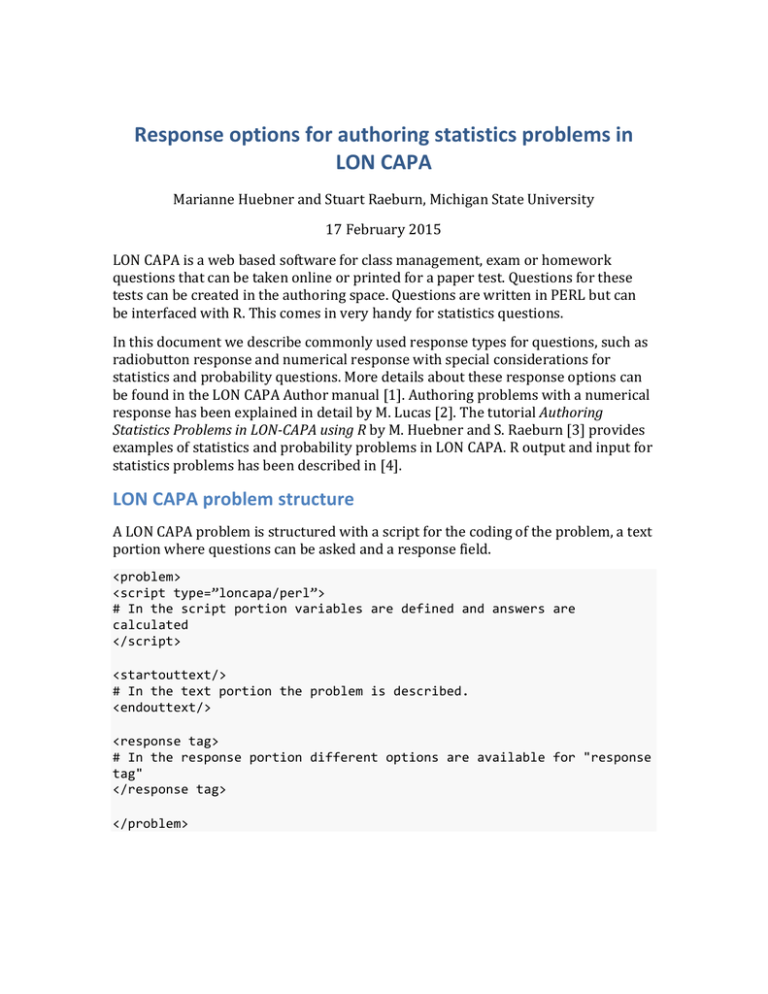
Response options for authoring statistics problems in LON CAPA Marianne Huebner and Stuart Raeburn, Michigan State University 17 February 2015 LON CAPA is a web based software for class management, exam or homework questions that can be taken online or printed for a paper test. Questions for these tests can be created in the authoring space. Questions are written in PERL but can be interfaced with R. This comes in very handy for statistics questions. In this document we describe commonly used response types for questions, such as radiobutton response and numerical response with special considerations for statistics and probability questions. More details about these response options can be found in the LON CAPA Author manual [1]. Authoring problems with a numerical response has been explained in detail by M. Lucas [2]. The tutorial Authoring Statistics Problems in LON-­‐CAPA using R by M. Huebner and S. Raeburn [3] provides examples of statistics and probability problems in LON CAPA. R output and input for statistics problems has been described in [4]. LON CAPA problem structure A LON CAPA problem is structured with a script for the coding of the problem, a text portion where questions can be asked and a response field. <problem> <script type=”loncapa/perl”> # In the script portion variables are defined and answers are calculated </script> <startouttext/> # In the text portion the problem is described. <endouttext/> <response tag> # In the response portion different options are available for "response tag" </response tag> </problem> Example: Weight of aspirin tablets The different types of response options will be explored in the example of a one sample inference problem for the population mean. An aspirin manufacturer fills bottles by weight rather than by count. The weight per tablet should be 𝜇! grain. Each of 𝑛 tablets taken from a very large lot is weighed resulting in a sample average weight per tablet of 𝑥 grain and a sample standard deviation of 𝑠 grain. Values of parameters for a probability distribution are defined in the script portion and a random sample from the distribution can be generated. <script type="loncapa/perl"> # set seed for simulating a data set in R $seed = &random(1,200000000,1); # Sample size $n=100; # generate a random sample from a normal distribution $sigma=0.3; $mu=5.05; ($data,$dump) = &cas_hashref("R","set.seed($seed);list<-­‐rnorm($n, mean=$mu, sd=$sigma);"); @sample = &cas_hashref_array($data); $xvalues = join(',', @sample); # sample mean and sample standard deviation $s=&roundto(&cas("R", "x<-­‐c($xvalues);sd(x)"),3); $xbar=&roundto(&cas("R", "x<-­‐c($xvalues);mean(x)"),2); # theoretial mean $mu0=5; </script> Reading the simulated data from the R output has been described in the tutorial R input and output by M. Huebner and S. Raeburn [4]. The text portion of problem includes values defined in the script portion such as the sample size $n or the sample mean $xbar. LaTex formulas and Greek letters, 𝜇, can be incorporated with the tag <m>$ \mu $ </m>, and values from the script portion can be used inside the tag <m eval="on"> $ \mu = $mu0 $</m>. Unfortunately, the commonly used \bar{x} and \hat{p} cannot be used as LaTex formulas. Using html code x&#772 or &#x035E;x for 𝑥 and p&#770 for 𝑝 gives an approximation with the overline and hat shifted to the right depending on the browser. At this time it appears easiest to use the words "xbar" and "phat". <p> <startouttext />An aspirin manufacturer fills bottles by weight rather than by count. The weight per tablet should be $mu0 grain. Each of $n tablets taken from a very large lot is weighed resulting in a sample average weight per tablet of xbar= $xbar grain and a sample standard deviation of <m> $ s =$ </m> $s grain. <endouttext /> </p> Radiobutton response Radiobutton response questions are very common in statistics and distractors can be easily incorporated for incorrect choices. Does the average weight of the tablets differs from 5 grain? What are the appropriate hypotheses? <radiobuttonresponse direction="vertical" max="10" id="10" randomize="yes"> <foilgroup> <foil location="random" value="true" name="foil1"> <startouttext /> <m eval="on"> $H_0: \mu = $mu0$ </m> vs <m eval="on"> $H_A: \mu \ne $mu0$ </m> <endouttext /> </foil> <foil location="random" value="false" name="foil2"> <startouttext /> <m eval="on"> $H_0: \mu = $mu0$ </m> vs <m eval="on"> $H_A: \mu > $mu0$ </m> <endouttext /> </foil> <foil location="random" value="false" name="foil3"> <startouttext /> <m eval="on"> $H_0: \mu = $mu0$ </m> vs <m eval="on"> $H_A: \mu < $mu0$ </m> <endouttext /> </foil> </foilgroup> </radiobuttonresponse> For questions about confidence intervals and hypothesis tests the answers are calculated in the script portion. ##### t test and t interval $alpha = 0.05; # significance level $clevel = 0.95; # confidence level ($ttestdata,$ttestdump) = &cas_hashref("R","x<-­‐c($xvalues); t.test(x, mu=5, conf.level=$clevel);"); # estimate $xbar = &roundto( &cas_hashref_entry($ttestdata,"estimate", "mean of x"),3) ; # pvalue $pval = &cas_hashref_entry($ttestdata,"p.value") ; # test statistic $tstat = &cas_hashref_entry($ttestdata,"statistic", "t"); # degrees of freedom $df = &cas_hashref_entry($ttestdata,"parameter", "df"); # mean appearing in H0 $mu0 = &cas_hashref_entry($ttestdata,"null.value", "mean"); # confidence interval @CI = &cas_hashref_array($ttestdata,"conf.int"); $lcl = &roundto($CI[0],3); $ucl = &roundto($CI[1],3); # critical value $t =&roundto( &cas("R", "qt((1+$clevel)/2, df=$df)"),3); Note: for a one-­‐sided hypothesis test, we need to use single quotes for the alternative: 'less' or 'greater'. ($ttestdata,$ttestdump) = &cas_hashref("R","x<-­‐c($xvalues); t.test(x, mu=5, conf.level=$clevel, alternative='less');"); ($ttestdata,$ttestdump) = &cas_hashref("R","x<-­‐c($xvalues); t.test(x, mu=5, conf.level=$clevel, alternative='greater');"); Radiobutton response with conditioning The correct response for a radiobutton response may depends on a condition. For example, if the p value is less than the significance level, there is evidence against the null hypothesis otherwise there is not enough evidence. # check for statistical significance $sig = 'false'; $sig0 = 'false'; $sig10 ='false'; # for answers that are always false if ($pval < $alpha) { $sig = 'true'; } if ($pval > $alpha) { $sig0 = 'true'; } The corresponding response is then written as follows: <radiobuttonresponse direction="vertical" max="10" id="15" randomize="no" TeXlayout="horizontal"> <foilgroup checkboxvalue="true" options="('true','false')" texoptions="nochoice" noprompt="1" checkboxoptions="nochoice"> <foil value="$sig" name="HA"> <startouttext />There is evidence that the weight of the tablets is different from $mu0 grain.<endouttext /> </foil> <foil value="$sig0" name="H0"> <startouttext />There is no evidence that the weight of the tablets is different from $mu0 grain.<endouttext /> </foil> <foil value="$sig10" name="wrongoption1"> <startouttext />The weight of the tablets is greater than $mu0 grain.<endouttext /> </foil> </foilgroup> </radiobuttonresponse> Option response Option response questions can be used as a list of choices where all that are correct need to be checked. <startouttext />Check all that apply<endouttext /> As an extension of the previous radiobutton response with conditioning we can check whether the p value for one or two-­‐sided alternative hypotheses are less than the significance level 𝛼. Here $pval is the calculated p value for a two sided hypothesis test and $pval1 is the corresponding p value for a one-­‐sided hypothesis test. #### Are the p values less than alpha? $twosided = 'not correct'; $onesided = 'not correct'; $twosidedA = 'not correct'; if ($pval < $alpha) { $twosided = 'correct'; } else { $twosidedA = 'correct'; } if ($pval1 < $alpha) { $onesided = 'correct'; } This allows for three options in the response in which one or at most two are correct depending on the p value. <optionresponse max="10" id="20" randomize="no" TeXlayout="horizontal"> <foilgroup checkboxvalue="correct" options="('correct','not correct')" checkboxoptions="nochoice"> <foil location="random" value="$twosided" name="pval"> <startouttext />When testing <m eval="on">$H_A: \mu \ne $mu0 $</m>, the result is statistically significant. <endouttext /> </foil> <foil location="random" value="$onesided" name="pval1"> <startouttext />When testing <m eval="on">$H_A: \mu > $mu0 $</m>, the result is statistically significant. <endouttext /> </foil> <foil location="random" value="$twosidedA" name="notsig"> <startouttext />When testing <m eval="on">$H_A: \mu \ne $mu0 $</m>, the result is not statistically significant. <endouttext /> </foil> </foilgroup> </optionresponse> In a rendering of this type of response as a multiple choice exam, each option would then be turned into a question with two choices "correct/not correct". Numerical response and formats For Numerical response questions students can enter their calculated answer online, and the answers are converted to multiple choice questions when the "Problem Type" is set to "Exam". When the format is specified and this problem is converted to multiple choice the options will be in the same format. •
•
•
format="3f" for three digits after the decimal point, e.g. 0.405 format="4s" for four digits, e.g 4.051, or 0.405, or 34.51 format="3E" for very small numbers such as p values, e.g 4.33 ⋅ 10!! is entered as 4.33e-­‐7 or 4.33E-­‐7. In the text these numbers are printed with a tag <num format="4f"> number </num>. However in an html table, the table should be enclosed with <parse></parse> and in the table cell the format <td><num format=\"2E\"> number </num></td> is used. What is the test statistic for testing whether the mean weight differs from $mu0? <numericalresponse format="3f" answer="$tstat" id="25"> <responseparam name="tol" type="tolerance" default="1.5%" description="Numerical Tolerance" /> <textline readonly="no" spellcheck="none" /> </numericalresponse> The format is three digits after the decimal point, format="4f" and the correct answer is $tstat. In the question text there can be a prompt to enter the response with accuracy to three digits after the decimal point. What is the p value when testing whether the mean weight differs from $mu0? When the answer is a probability the multiple choice options have to be between 0 and 1. This needs to be specified as shown below. In addition, it is possible to include specific incorrect answers, for example a p value calculated for two-­‐sided or one-­‐sided hypothesis tests. The general format for such a code is @include=($val1, $val2,$val3); # choices to be included @array = &wrong_bubbles($correct,$min,$max,$step,@include); This includes the correct answer, the minimum and maximum values, and step size for the range of options. It is optional to include one or more specified values in @include. A scalar can be entered directly, otherwise the list of values to be included can be defined in the array @include. For the t test example, we can define the range of probabilities between 0 and 1 in steps of 0.01, and include one specific probability $pval2. @probs = &wrong_bubbles($pval,0,1,0.01,$pval2); <numericalresponse format="4f" answer="$pval" id="30" incorrect="@probs"> <responseparam name="tol" type="tolerance" default="2%" description="Numerical Tolerance" /> </numericalresponse> If a student enters a specific incorrect answer, a hint can appear for the online version of the problem. For example, when the correct p value is the p value calculated for a two-­‐sided hypothesis test ($pval), a common mistake is to enter the p value for a one-­‐sided hypothesis test ($pval2) or vice versa. If the student enters this specific incorrect answer, we can code the problem so that the question "Is this a one-­‐sided or two-­‐sided hypothesis test?" appears. <numericalresponse format="4f" answer="$pval" id="35" incorrect="@probs"> <responseparam name="tol" type="tolerance" default="2%" description="Numerical Tolerance" /> <hintgroup showoncorrect="no"> <numericalhint format="4f" answer="$pval2" name="onesided" id="40"> <responseparam name="tol" type="tolerance" default="1%" description="Numerical Tolerance" /> </numericalhint> <hintpart on="onesided"> <startouttext /> Is this a one-­‐sided or two-­‐sided hypothesis test? <endouttext /> </hintpart> </hintgroup> <textline readonly="no" spellcheck="none" /> </numericalresponse> A simple hint after the first wrong submission can be added within the <numericalresponse> </numericalresponse> tags. <hintgroup showoncorrect="no"> <startouttext /> Hint: <endouttext /> </hintgroup> Options for hints are available during the Edit process in the Response Block, where one can add hints or the Hint Block witin the response where one can insert a conditional hint, custom hint condition, and more. A step-­‐by-­‐step tutorial for the numerical response and hints are given by M. Lucas [2]. Parts and random lists of questions Several questions refering to the same statistics problem are encased by <part></part>. For example, <part id="tstat"> <startouttext />What is the test statistic for this hypothesis test?<endouttext /> <numericalresponse format="3f" answer="$tstat"> SAME AS ABOVE </numericalresponse> </part> <part id="pvalue"> <startouttext /> What is the p value for this hypothesis test? <endouttext /> <numericalresponse format="4f" answer="$pval"> SAME AS ABOVE </numericalresponse> </part> One can randomly choose to show only one of these two questions. <randomlist show="1"> <part id="tstat"> </part> <part id="pvalue"> </part> </randomlist> If there are more than two parts, and, for example, 4 of 5 problems are shown with <randomlist show="4">, then the order of the four shown problems is random. Conclusion In this tutorial we gave examples for a radiobutton response, conditional radiobutton response, option response, and numerical response in the context of statistical inference for a population mean. References [1] LON CAPA Documentations: http://www.lon-­‐capa.org/documentation.html [2] M. Lucas. Authoring Numerical Problems in LON CAPA: Step-­‐By-­‐Step. 2014. http://www.lon-­‐capa.org/conf2014/AuthoringNumericalProblemsTutorialv0.2.pdf [3] M. Huebner and S Raeburn. Authoring Statistics Problems in LON-­‐CAPA using R (2014) https://loncapa.msu.edu/res/msu/statlib2msu/Documentation/loncapa_statsR.pdf [4] M. Huebner and S Raeburn. R input and output for authoring statistics problems in LON CAPA (2014). https://loncapa.msu.edu/res/msu/statlib2msu/Documentation/loncapa_dataR.pdf


