NEW APPLICATION FIELD FOR THE HANDYSCAN 3D: THE RES GESTAE... AUGUSTI OF THE AUGUSTUS TEMPLE (ANKARA). A RESTORATION SURVEY
advertisement
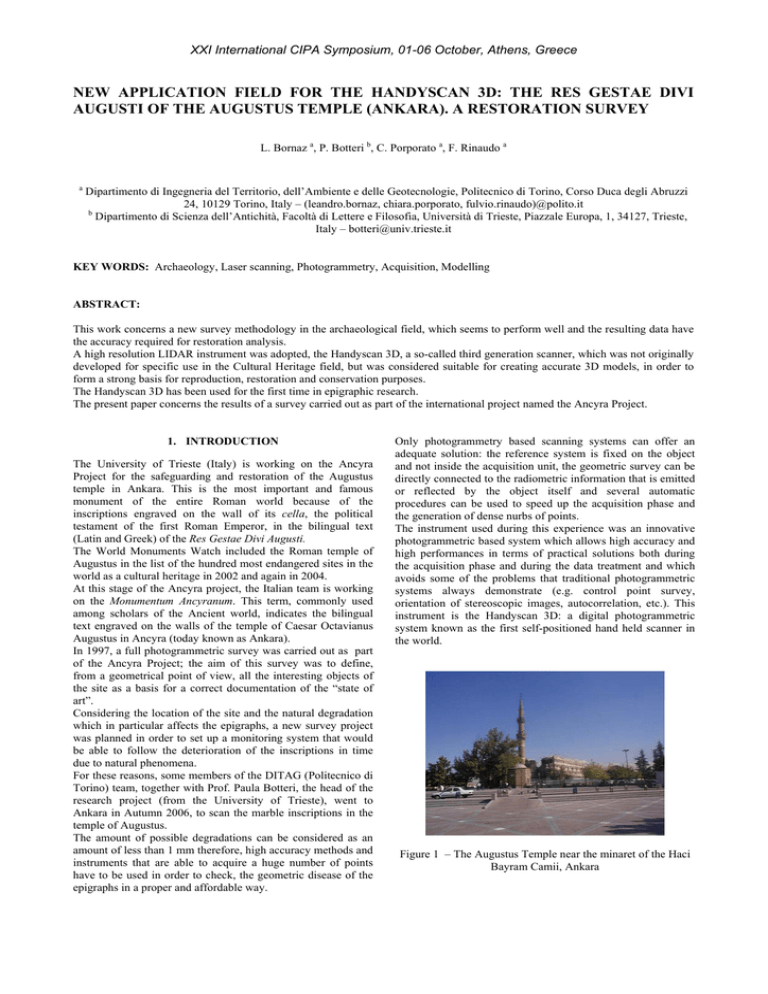
XXI International CIPA Symposium, 01-06 October, Athens, Greece NEW APPLICATION FIELD FOR THE HANDYSCAN 3D: THE RES GESTAE DIVI AUGUSTI OF THE AUGUSTUS TEMPLE (ANKARA). A RESTORATION SURVEY L. Bornaz a, P. Botteri b, C. Porporato a, F. Rinaudo a a Dipartimento di Ingegneria del Territorio, dell’Ambiente e delle Geotecnologie, Politecnico di Torino, Corso Duca degli Abruzzi 24, 10129 Torino, Italy – (leandro.bornaz, chiara.porporato, fulvio.rinaudo)@polito.it b Dipartimento di Scienza dell’Antichità, Facoltà di Lettere e Filosofia, Università di Trieste, Piazzale Europa, 1, 34127, Trieste, Italy – botteri@univ.trieste.it KEY WORDS: Archaeology, Laser scanning, Photogrammetry, Acquisition, Modelling ABSTRACT: This work concerns a new survey methodology in the archaeological field, which seems to perform well and the resulting data have the accuracy required for restoration analysis. A high resolution LIDAR instrument was adopted, the Handyscan 3D, a so-called third generation scanner, which was not originally developed for specific use in the Cultural Heritage field, but was considered suitable for creating accurate 3D models, in order to form a strong basis for reproduction, restoration and conservation purposes. The Handyscan 3D has been used for the first time in epigraphic research. The present paper concerns the results of a survey carried out as part of the international project named the Ancyra Project. 1. INTRODUCTION The University of Trieste (Italy) is working on the Ancyra Project for the safeguarding and restoration of the Augustus temple in Ankara. This is the most important and famous monument of the entire Roman world because of the inscriptions engraved on the wall of its cella, the political testament of the first Roman Emperor, in the bilingual text (Latin and Greek) of the Res Gestae Divi Augusti. The World Monuments Watch included the Roman temple of Augustus in the list of the hundred most endangered sites in the world as a cultural heritage in 2002 and again in 2004. At this stage of the Ancyra project, the Italian team is working on the Monumentum Ancyranum. This term, commonly used among scholars of the Ancient world, indicates the bilingual text engraved on the walls of the temple of Caesar Octavianus Augustus in Ancyra (today known as Ankara). In 1997, a full photogrammetric survey was carried out as part of the Ancyra Project; the aim of this survey was to define, from a geometrical point of view, all the interesting objects of the site as a basis for a correct documentation of the “state of art”. Considering the location of the site and the natural degradation which in particular affects the epigraphs, a new survey project was planned in order to set up a monitoring system that would be able to follow the deterioration of the inscriptions in time due to natural phenomena. For these reasons, some members of the DITAG (Politecnico di Torino) team, together with Prof. Paula Botteri, the head of the research project (from the University of Trieste), went to Ankara in Autumn 2006, to scan the marble inscriptions in the temple of Augustus. The amount of possible degradations can be considered as an amount of less than 1 mm therefore, high accuracy methods and instruments that are able to acquire a huge number of points have to be used in order to check, the geometric disease of the epigraphs in a proper and affordable way. Only photogrammetry based scanning systems can offer an adequate solution: the reference system is fixed on the object and not inside the acquisition unit, the geometric survey can be directly connected to the radiometric information that is emitted or reflected by the object itself and several automatic procedures can be used to speed up the acquisition phase and the generation of dense nurbs of points. The instrument used during this experience was an innovative photogrammetric based system which allows high accuracy and high performances in terms of practical solutions both during the acquisition phase and during the data treatment and which avoids some of the problems that traditional photogrammetric systems always demonstrate (e.g. control point survey, orientation of stereoscopic images, autocorrelation, etc.). This instrument is the Handyscan 3D: a digital photogrammetric system known as the first self-positioned hand held scanner in the world. Figure 1 – The Augustus Temple near the minaret of the Haci Bayram Camii, Ankara XXI International CIPA Symposium, 01-06 October, Athens, Greece A comparison of the results producted by the different survey campaigns performed in two different epochs makes it possible for the specialist to detect any modifications of the studied object over a period. 2. THE SURVEYED OBJECT 2.1 The Augustus Temple The Augusteum in Ankara was a pseudodipteros temple of the Corinthian order (36 x 54.82 m) standing on a podium about two metres high (Figs.1-2-3). At present only the pronaos, the opisthodome and the two side walls of the cella of the original temple of Augustus and the goddess Roma in Ankara remain. One of these walls stands intact while the other one is partially in ruins. Politecnico di Torino before flying to Ankara, because of the size of the stone surface of the wall that had to be surveyed. A very meticulous study was theorically conducted. The inscriptions of the three separate walls of the temple of Augustus stand above the ground: the Greek epigraph is situated about 2 m from the ground, and the two Latin inscriptions are higher than the Greek one. This position is strategic to make the epigraph visible from a distance, but it is not very easy to survey. For this reason two trestles were used to reach the carved stones (Fig. 4). Figure 4 – The Greek epigraph with the used trestles Figure 2 – The Augustus Temple in Ankara - M. Schede - D. Krencker 1936 Figure 3 – The entrance of the temple in an ancient print The Latin text of the Res Gestae Divi Augusti which is symmetrically arranged in a sequence of six columns of writing, three on each side, each measuring 3.60 m in width and 2.48 m heigh, can be found on the inside of the pronaos, the walls on either side of the cella. The Greek translation is engraved on the outer wall on the side of the cella which is still intact. It is carved on 19 columns, each being approximately 1 m wide (total 20.30 m) and 1.25 m high. The total surface of the Latin and Greek inscriptions amounts to 39.40 m². 3. THE SURVEY PROJECT The mission was planned to the last detail in the Land, Environment and Geo-Engineering Department of the Figure 5 – A scan acquisition from the trestle of a portion of one of the Latin epigraphs In order to survey the Latin text and Greek translation, a series of scan acquisitions was performed to cover the entire surface and measure all the different parts. The work was divided into a series of operations. 3.1 The”pre”-survey phases The three areas were subdivided into several 80x80 cm subareas so that there was an overlapping zone between each scan (Fig. 6). The surveyed volume is subdivided into voxels. The dimension of the voxels (the resolution of the survey) depends on the dimension of the acquisition volume. XXI International CIPA Symposium, 01-06 October, Athens, Greece The reference system was set up by fixing reflective targets onto the object creating an irregular mesh with sides that sometimes reached up to 10 cm. The reflective targets were surveyed using the two stereoscopic cameras and eight spots around them. The targets were then placed in a unique reference system which was then fixed onto the object. During the survey, the stereoscopic cameras performed the absolute orientation using the previously acquired reflective targets (Fig. 9). Figure 6 – The Augustus Temple in Ankara It is possible to choose from three different resolution levels: low, medium or high. If high resolution is required, the object has to be split into different scans which are oriented in the acquisition reference system thanks to the previously acquired reflective targets that are placed on the surface of the object. The accuracy is always the highest accuracy of the instrument. The walls where the Latin inscriptions are carved were both surveyed by subdividing them into 12 boxes (Fig.7). The Greek epigraph was scanned creating 52 boxes along two different rows (Fig. 8). After the theoretical division of the studied surface, the wall was prepared for the subsequent acquisition phases by positioning a total of approximately 20000 markers for the whole wall. Figure 9 – A portion of wall covered by the markers Eleven vertices were set up in the ground around the Temple to create a topographical control network. Finally, a photogrammetric survey was planned using a DSC 14Pro Kodak camera. Figure 7 – Rough 3D models of the Latin inscription (right and left sides) Figure 8 – Rough 3D models of the Greek inscription XXI International CIPA Symposium, 01-06 October, Athens, Greece 3.2 The survey operation The second step was the surveying operation. First of all the Handyscan was geometrical calibrated as the several hours of flying could have led to variations in the calibration parameters of the instrument. The geometric calibration was performed using a special control plate which is provided with the instruments (Fig.10). The radiometric calibration was aimed at setting the photographic parameters for the two camera lenses and the intensity of the laser tracker in order to speed-up the measurement process. This procedure was performed by acquiring some parts of the object with a common texture. Due to all the previously mentioned problems, the best working time was in the early hours of the morning, the late afternoon and the evening when the markers only reflected the red light of the eight leds, as shown in Figure 12. Figure 10 – The geometric calibration of the Handyscan The scope of this phase was to refine the relative orientation of the two digital cameras in order to avoid small movements of the mechanical components that occur during transportation or due to the change in environmental conditions and so on. The geometric calibration fixed the base of the photogrammetric system and therefore the scale of the survey. The laser acquisitions were carried out from the trestle: it took about an hour of acquisition to survey about 3 or 4 sub-areas depending on the complexity and deterioration conditions of the surface. The length of the survey also depended on the lighting conditions. During the middle hours of the day the daylight was reflected by the markers. This phenomena created a sort of noise in the data acquisition. Working in these conditions was very time consuming for several reasons. First, in order to avoid errors during the acquisition, the scans were carried out in a much slower manner than normal. Then, the continuous change in lighting made it necessary to repeat the radiometric calibration of the scan several times. Moreover, the wall surfaces present different colours due to pollution and mould and these characteristics also made it necessary to repeat the radiometric calibration before starting the acquisition on the portion of interest (Fig. 11). Figure 11 – Example of radiometric calibration of the Handyscan Figure 12 – Example of acquisition in the morning and in the evening Considering the dimensions of the epigraph, each one had to be subdivided into small portions of less than about 1 m2. Each portion overlapped the adjacent ones by a percentage of about 10% in each direction in order to allow the accuracy to be controlled and a correct mosaic of the single acquisitions to be made. When the operator started the scan acquisition with the Handyscan, she/he was able to check the distance between the acquisition unit and the object and control how the acquisition was progressing by looking at a laptop where the acquired data were displayed in real time in STL format. (The recorded data are: the target positions and the STL format 3D model). The absolute orientation was performed, during the scan acquisition, by stereoscopic cameras using the previously acquired reflective targets. The topographic network and a chosen part of the markers were topographically surveyed in order to express all the acquired data in a unique reference system (Fig. 13). In this way each surveyed portion could be referred to a unique reference system defined by means of a control network. The network was surveyed using a traditional topographic survey total station (Fig. 14) and using the rigorous approach of redundant observations. About 1700 measurements were conducted. All of them have been adjusted by using the least square method. The statistical results of the network are summarize in the table 1. The stored data were elaborated in order to align the acquired scans and geroreference them in a local reference system. The final model was coloured using the radiometric information acquired during the photogrammetric survey in order to obtain a realistic model. XXI International CIPA Symposium, 01-06 October, Athens, Greece Figure 13 – The measured topographic network Figure 14 – The topographic measurements and the used instruments Measured angles Measured distances N. of vertices m.s.e. in the X and Y directions m.s.e. in the Z direction 1302 342 446 0.002 m 0,001 m Figure 15 – Scans before the registration phase Table 1 – The statistical results of the network set up in the Augustus Temple in Ankara 3.3 Data processing The handling of acquired data can be performed using one of the well known software packages (e.g. RapidForm, PolyWorks., etc.). CREAFORM has a special link with Geomagic Studio which can directly manage the data from the Handyscan 3D system. The accuracy of the acquired data, their flexible resolution and the real time check of the completeness of the acquisition phase are the best requirements for a quick and correct model approach. The acquired points were processed using a commercial software (Geomagic) and a scientific software developed by the Politecnico di Torino (LSR2004) in order to build a 3D model of the three inscriptions (Figs. 15-16). All the gross errors and outliers were eliminated and a correct registration of the single acquisitions was performed using an original approach developed by our Research Group. Figure 16 – 3D models of the surfaces after the complete registration phase As previously mentioned, the overlap between each part of the acquired sub-areas was about 10% and each portion contained some known points (approximately 20 points for each portion). A first registration of the portions was performed using the ICP approach (a well known method used in many commercial software programs to register point sets). Considering the small overlap, many systematic errors arose therefore a least square XXI International CIPA Symposium, 01-06 October, Athens, Greece compensation of all the portions of a single object was computed using all the information obtained from existing known points on the surface. 3.4 Final products A realistic 3D model, Figure 17, of the three epigraphs was produced by mapping the oriented images onto the 3D point model after a surface generation (TIN approach). This represents the most important output of this kind of survey technique and allows a complete and exhaustive analysis of the object to be made by the specialists. 5. REFERENCES Botteri P., Fangi G, The Augustus' temple. Preliminary and Photogrammetrical report in 1997. The 20th International Symposium of Excavations, Survey and Archeometry TARSUS, ANKARA - May 25-29 1998. Botteri P., Fangi G., Nardinocchi G. 1999, The photogrammetric survey of Res Gestae in Ankara PROCEEDINGS OF C.I.P.A, RECIFE-OLINDA, BRASILE, OCTOBER 1999). Botteri P., 2002 Ancyra, rappresentazione delle “Res Proceedings of "impact of presentation and perception of MARCH 20-23. Antiochia e Apollonia. La Gestae Divi Augusti, s.p. empire. Workshop iii. The roman imperial power, Rome, Bornaz L., Rinaudo F., Terrestrial laser scanner data processing - XXth ISPRS Congress Istanbul - July 2004. Rinaudo F., Bornaz L, Peretti L, Porporato C. (2006). New Trends in High Resolution Survey for the Cultural Heritage Metric Survey Applications for Restoration.. in: Ioannides M., Arnold D., Niccolucci F., Mania K. The e-volution of Information Communication Technology in Cultural Heritage. (pp. 169-174). isbn: 109638046740. Budapest: Archaeolingua (Hungary). Figure 17 – 3D realistic model 4. CONCLUSIONS The laser instrument worked for several hours without any problems: the Handyscan 3D proved to be stable and reliable and could be used for a long period without stopping the acquisition. This characteristic made it possible to carry out the survey of the whole inscription of the Res Gestae Divi Augusti (39.40 m²), the Latin version and the Greek one, in just one week. The time needed to perform the survey (in our case about 48 hours for a surveyed surface of about 40 m2) is not so long if we consider the final results in terms of completeness and accuracy (approx. 0.2 mm). Had a different laser instrument been used with the same accuracy characteristic, the acquisition phase would surely have taken longer. The new generation of high resolution scanning systems seems to be suitable and can be profitably used in Cultural Heritage documentation. They allow all the problems concerning the stability of the reference system to be avoided. The image acquisition and orientation is still a problem because these phases are not integrated in the 3D point acquisition process but the authors believe that future technological developments will allow this kind of integration to take place has already happened in the field of lower accuracy scanning systems. As far as the practical use of this kind of surveys for the monitoring of the degradation of old stones is concerned, the authors intend repeating the survey of some samples of the surfaces in order to control the degradations due to atmospheric effects in a statistical approach. The present work will be published in the the Ancyra Project web-site: http://www.univ.trieste.it/~ANCYRA/.

