MANAGING UNCERTAINTY IN THE DETECTION OF CHANGES FROM
advertisement
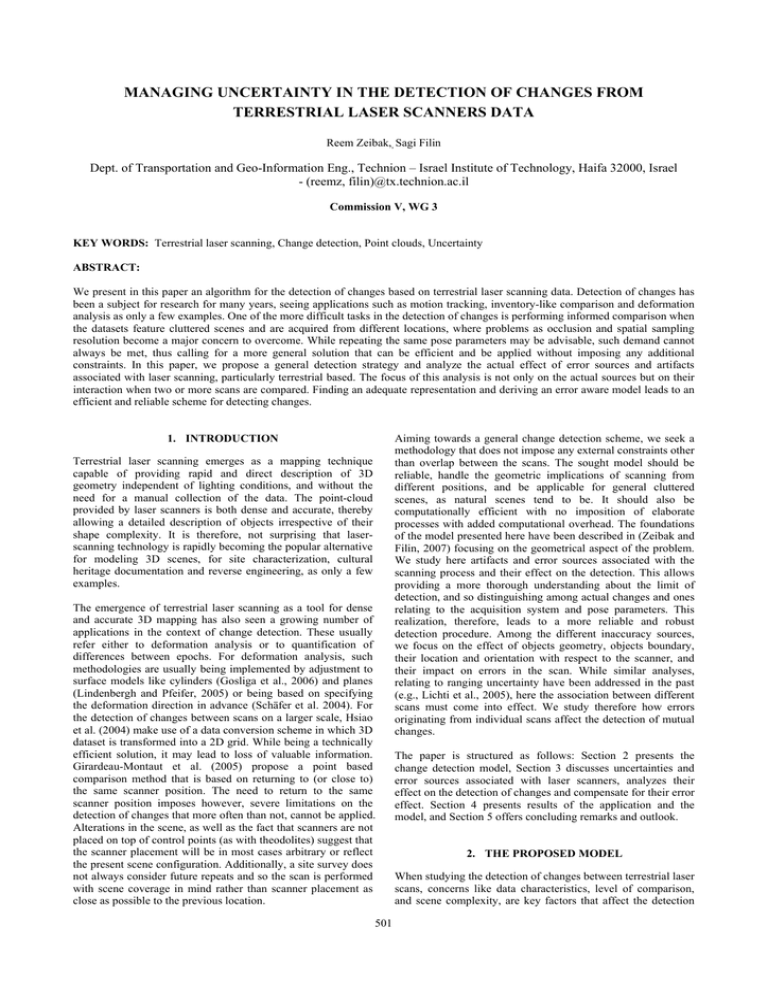
MANAGING UNCERTAINTY IN THE DETECTION OF CHANGES FROM TERRESTRIAL LASER SCANNERS DATA Reem Zeibak,, Sagi Filin Dept. of Transportation and Geo-Information Eng., Technion – Israel Institute of Technology, Haifa 32000, Israel - (reemz, filin)@tx.technion.ac.il Commission V, WG 3 KEY WORDS: Terrestrial laser scanning, Change detection, Point clouds, Uncertainty ABSTRACT: We present in this paper an algorithm for the detection of changes based on terrestrial laser scanning data. Detection of changes has been a subject for research for many years, seeing applications such as motion tracking, inventory-like comparison and deformation analysis as only a few examples. One of the more difficult tasks in the detection of changes is performing informed comparison when the datasets feature cluttered scenes and are acquired from different locations, where problems as occlusion and spatial sampling resolution become a major concern to overcome. While repeating the same pose parameters may be advisable, such demand cannot always be met, thus calling for a more general solution that can be efficient and be applied without imposing any additional constraints. In this paper, we propose a general detection strategy and analyze the actual effect of error sources and artifacts associated with laser scanning, particularly terrestrial based. The focus of this analysis is not only on the actual sources but on their interaction when two or more scans are compared. Finding an adequate representation and deriving an error aware model leads to an efficient and reliable scheme for detecting changes. 1. INTRODUCTION Terrestrial laser scanning emerges as a mapping technique capable of providing rapid and direct description of 3D geometry independent of lighting conditions, and without the need for a manual collection of the data. The point-cloud provided by laser scanners is both dense and accurate, thereby allowing a detailed description of objects irrespective of their shape complexity. It is therefore, not surprising that laserscanning technology is rapidly becoming the popular alternative for modeling 3D scenes, for site characterization, cultural heritage documentation and reverse engineering, as only a few examples. The emergence of terrestrial laser scanning as a tool for dense and accurate 3D mapping has also seen a growing number of applications in the context of change detection. These usually refer either to deformation analysis or to quantification of differences between epochs. For deformation analysis, such methodologies are usually being implemented by adjustment to surface models like cylinders (Gosliga et al., 2006) and planes (Lindenbergh and Pfeifer, 2005) or being based on specifying the deformation direction in advance (Schäfer et al. 2004). For the detection of changes between scans on a larger scale, Hsiao et al. (2004) make use of a data conversion scheme in which 3D dataset is transformed into a 2D grid. While being a technically efficient solution, it may lead to loss of valuable information. Girardeau-Montaut et al. (2005) propose a point based comparison method that is based on returning to (or close to) the same scanner position. The need to return to the same scanner position imposes however, severe limitations on the detection of changes that more often than not, cannot be applied. Alterations in the scene, as well as the fact that scanners are not placed on top of control points (as with theodolites) suggest that the scanner placement will be in most cases arbitrary or reflect the present scene configuration. Additionally, a site survey does not always consider future repeats and so the scan is performed with scene coverage in mind rather than scanner placement as close as possible to the previous location. 501 Aiming towards a general change detection scheme, we seek a methodology that does not impose any external constraints other than overlap between the scans. The sought model should be reliable, handle the geometric implications of scanning from different positions, and be applicable for general cluttered scenes, as natural scenes tend to be. It should also be computationally efficient with no imposition of elaborate processes with added computational overhead. The foundations of the model presented here have been described in (Zeibak and Filin, 2007) focusing on the geometrical aspect of the problem. We study here artifacts and error sources associated with the scanning process and their effect on the detection. This allows providing a more thorough understanding about the limit of detection, and so distinguishing among actual changes and ones relating to the acquisition system and pose parameters. This realization, therefore, leads to a more reliable and robust detection procedure. Among the different inaccuracy sources, we focus on the effect of objects geometry, objects boundary, their location and orientation with respect to the scanner, and their impact on errors in the scan. While similar analyses, relating to ranging uncertainty have been addressed in the past (e.g., Lichti et al., 2005), here the association between different scans must come into effect. We study therefore how errors originating from individual scans affect the detection of mutual changes. The paper is structured as follows: Section 2 presents the change detection model, Section 3 discusses uncertainties and error sources associated with laser scanners, analyzes their effect on the detection of changes and compensate for their error effect. Section 4 presents results of the application and the model, and Section 5 offers concluding remarks and outlook. 2. THE PROPOSED MODEL When studying the detection of changes between terrestrial laser scans, concerns like data characteristics, level of comparison, and scene complexity, are key factors that affect the detection The International Archives of the Photogrammetry, Remote Sensing and Spatial Information Sciences. Vol. XXXVII. Part B5. Beijing 2008 strategy. Regarding the level of comparison, it may be applied at the point level by comparing a point to its surrounding, at the feature level via primitive based comparison (e.g., planes or conics), and the object level by comparing objects and their shape variation between epochs. For an efficient model, we adopt a point based change detection model, opting towards a model that does not require elaborate preprocessing stage, e.g., segmentation or object extraction that incur high computational overhead. 2.1 Data representation 3D laser scans can be considered as range panoramas whose axes are the latitudinal and longitudinal scanning angles, and the ranges are the intensity values. As the angular spacing is fixed (defined by system specifications), regularity becomes an established property of this representation. Relation between the Cartesian and the polar data representation is given in Equation (1). A naive point-based comparison in 3D space will be implemented by searching for a point’s counterpart within a spatial neighborhood. Such comparison faces however hurdles due to the irregular point distribution, variation in scale, and huge data volume in each scan. The varying resolution within each scan and between scans inflicts on the level of detail in which individual objects are described and requires an adaptive point neighborhood definition. Additionally, parts of the field of view will oftentimes be occluded by objects (walls most often) that block their line of sight. While, parts of some regions are occluded in one scan, they can be visible in the other, and so might wear a “change-like” form in a point-to-point comparison scheme. Such features affect the ability to compare the two scans in a naive neighborhood-search manner, and require introducing an object notion into the detection. (x, y, z )T = (ρ cos ϕ cos θ , ρ cos ϕ sin θ , ρ sin ϕ )T (1) with x, y and z the Euclidian coordinates of a point, φ and θ are the latitudinal and longitudinal coordinates of the firing direction respectively, and ρ is the measured range. Δθ, and Δφ, the angular spacing, define the pixel size. Figure a shows range data in this representation where the x axis represents the θ value, θ ∈ (0,2π], and, the y axis represents the φ value, with φ ∈ (-π/4,π/4] for this scan. The arrangement of the irregular 3D point cloud into a panoramic form offers not only a compact representation (which is less of a concern here) but more importantly an organization of the ranges according to their viewing direction. To some degree, this representation can be viewed as tiling of the data, where the pixel size in angular terms defines a region where the measured range is the best information source. This contributes to the connectivity notion as featured in Figure a. Since size is defined here in angular terms, the varying distance between consecutive points and scan-lines cease being a factor. Change detection between scans can also be approached by asking whether a point that was measured in one scan can be seen by the other scanner. Three cases can arise from such a comparison scheme: i) yes, the point can be seen, but there is no counterpart object in the reference scan, namely a change, ii) yes, the point can be seen, and it is lying on an object, namely no change, and iii) no, the point cannot be seen, as there is an item hiding it, and due to lack of any other information we mark it as no change. Approaching the detection problem in this manner requires a different representation of the 3D point cloud. The following sections present the representation and the derived detection model. To assess if a point that was measured in one scan can be seen by the reference one, the evaluated scan should be transformed into the same frame as the reference scan. Even though the range dataset are assumed registered, each range panorama is given in a local scanner coordinate system. a. b. Figure 1: Range panorama applied for the detection of changes a. Reference scan. b. Analyzed scan transformed into the reference frame. 502 The International Archives of the Photogrammetry, Remote Sensing and Spatial Information Sciences. Vol. XXXVII. Part B5. Beijing 2008 with dij pixel in the difference image, Rij pixel in the reference image, Aij pixel in the analyzed one, and ε an accuracy threshold. This image subtraction in the range panorama representation has some appealing properties: i) when a scan is transformed into the view point of the reference scan, occluded areas of the analyzed scan become "no-information" (or void) regions, as Figure b shows and therefore have no "change-like" effect; ii) regions seen from the analyzed scan but not from the reference scan (occluded by the reference) will fall behind the occluding objects. As such, they have bigger range values than those of the occluding objects and, therefore, a "no change" status, and iii) scale – since objects close to the scanner position occupy more pixels and far objects occupy less, the need to characterize multi-scale comparison arises. However, as objects from the analyzed scan are transformed into the reference scan frame, object scale differences will be resolved in large. Having the exterior orientation parameters (position and orientation) of both scans, it is possible to obtain their relative orientation in order to ease their transformation into a common reference frame. Given the transformation models for the two scans x w = R1x1s + t1 (2) x w = R 2 x 2s + t 2 with t1 , R1 , t 2 , R 2 the position and orientation matrices of the two scanners, x 2s = ⎡⎣ X s2 Ys2 respectively, and x1s = ⎡⎣ X s1 Ys1 Z s1 ⎤⎦ t , Z s2 ⎤⎦ the 3D coordinates of a given laser point in t As can be noticed, the change detection is directional, namely negative differences, which are due to occlusion, cannot be described as changes. Additionally, "no-data" (no-information) regions in the transformed scan cannot be interpreted as a change (for consistency with the above definition and for implementation purposes, we assign "max-range" values there). So, in order to assess the overall difference between two epochs, changes should be mutually detected between the different scans, with the comparison between the reference scan and the analyzed scan telling what appears in the analyzed but not in the reference, and the reverse comparison telling what appears in the analyzed scan but not in the reference. Their union comprises the overall change; their exclusion reveals the static objects in the scene. the individual scanners local frames, as given by Equation (1), the relative orientation between the two scans can be formed. This orientation should be formed in a way that the reference scanner is located at the origin of the common Cartesian frame and that its orientation is set to be zero, and that the analyzed scanner will be located and oriented relatively to the reference one. Representing a point sampled by the analyzed scanner in the reference frame will then be given by x1s = R1t R 2 x 2s + R1t (t 2 − t1 ) N R 2′ (3) t 2′ 2.3 Point proximity Despite the simplicity and efficiency of range subtraction, some adaptations that relate to potential errors in the ranging process need to be made. These relate to some sensitivity in cases where the incidence angle between the scanner and the surface becomes high. and so, transforming a point from the analyzed scan to the reference frame has the form of a rigid body transformation with R 2 ' the relative rotation and t 2 ' the relative translation. The relative transformation of the analyzed scan into the reference scan coordinate system allows working in the same coordinate frame, a property that disappeared with the formation of the range panoramas. A subsequent step of this transformation will be computing the pointing angle and range N 2 Δh This transformation leads to an angular correspondence between the reference and the transformed analyzed scans. Applying this transformation to the whole analyzed scan will then have the notion of asking how the scan (namely the data acquired in the scan) looks from the reference scanner position. Figure b shows the analyzed scan as transformed into the viewing point of the reference scanner in Figure a. In points where the incidence angle α between the beam and the surface normal is relatively big, evaluating point proximity between counterparts becomes sensitive as the beam is almost parallel to the object surface and therefore leads to greater uncertainty in the ranging Δρ (see Figure 2). Variation in the scanning direction and thus in the incidence angles, would result in spatially different points that describe the same object. However, the distance between the corresponding points along the surface normal direction in the reference frame Δh provides a more subtle evaluation for point proximity in the detection of changes. Therefore, some modifications are made for points resulting in big difference of incidence angles in both scans, by testing the distance between the observed counterparts in the direction of the surface normal, and deciding whether the point When transformed, comparison between the scans can be reduced with some adaptations, into a mere image subtraction. The detection of changes will then be based on the following: di, j Ri , j − Ai , j > ε Ri , j − Ai , j ≤ ε Ri , j − Ai , j < −ε α Figure 2: Range difference in reference frame, projected to the surface normal direction. 2.2 Detection of changes ⎧ change ⎪ = ⎨ no change ⎪occlusion (no change) ⎩ Δρ Reference to the measured point x s as seen from the reference scanner. (4) 503 The International Archives of the Photogrammetry, Remote Sensing and Spatial Information Sciences. Vol. XXXVII. Part B5. Beijing 2008 is far from the pre scanned surface or not. This modification requires an efficient normal vector computation that needs to be performed only on the reference scan, as points in the analyzed scan are compared to what have been scanned in the reference and not vice versa. Pole 3. LASER BEAM UNCERTAINTY AND ERROR SOURCES Figure 4: Demonstration of artifacts due to sliver points along the tangency plane of an object. So far, a geometrical interpretation of the detection of changes has been proposed. Nonetheless, errors associated with the scanning process exist and unless treated, affect the quality of the results by increasing the level of false alarms. Errors can largely be divided into random components associated with measuring process, and artifacts. Figure 4 provides one example demonstrating those artifacts, showing the point cloud of a pole scanned from close range (about 2-3m). Other than the pole's front, phantom points can be seen around it, relating to transmitted pulses that are tangent to its borders. Other than proximity to boundaries, the geometrical structure of an object can cause similar artifacts. For example, holes within bodies scanned close to the scanner (about 2-3m) result in outliers in the scanning direction (see figure 5). 3.1 Random error sources Random errors in raw laser measurements lead to uncertainty in 3D point position and therefore need to be modeled. The significant error components in the laser scanning systems refer to the ranging σ ρ [m] and to the recording of angular firing direction σ ϕ , σ θ [rad ] . A proper error propagation of such Chain uncertainties can provide a theoretical estimate for the threshold value of the range difference, ε , needed in the proposed change detection. 3.2 Artifacts The random error budget features only one aspect of the laser related inaccuracies. Other elements are termed here artifacts since they are manifested as outlying points within a point cloud but exhibit neither random nor systematic trend. Their causes stem from a variety of sources, and their magnitude varies from one case to the other. Discussion about artifacts that characterize laser scanners can be found in Lichti et al. (2005), Sotoodeh (2006), and Barnea and Filin (2008). These data artifacts wear different effects like: angular displacement, mixed pixels, saturation, blooming, multi-path and no-reflectance points. Figure 5: A shower of outlying points formed due to a hollow structure and a chain form. In terms of their effect on the change detection process, a point based model that compares points in one scan to their counterparts in the other, can assign those points a “changelike” tag. This realization has to do with the fact that they do not refer to the observed objects structure in reality (see figure 6) and therefore cannot be scanned twice. Consequently they will not find counterparts in other scans. Chain Pole Figure 6: Results showing the data following the elimination of edge related artifacts. Figure 3: Sliver points formed along the tangent planes to a scanned object. Most error sources tend to appear around tangency lines or planes to the surveyed objects. Due to the laser beam width, ranging artifacts mainly appear in discontinuity regions; where from a single ranging, multiple returns of different objects occur. The ranging artifacts linked to object contours (termed also edge effect) lead to outlying points that appear in the data but do not exist in reality and cannot be referred to any object structure (See figure 3). 504 Figure 7 illustrates this scenario where the cylinder shape element in front of the "red" scanner causes phantom points to follow its tangent plane (as in figure 4), while a scanner placed in the "blue" position will only view the wall in front of it. Comparing "red" scan to the "blue" one shows the entire phantom points as actual changes, as they are placed in front of the blue object (the wall) and have no counterpart points there. The International Archives of the Photogrammetry, Remote Sensing and Spatial Information Sciences. Vol. XXXVII. Part B5. Beijing 2008 The analysis begins with testing the raw range based comparison process. This phase involves only the transformation of the analyzed range panorama into the reference one and performing image subtraction as presented in Section 2.2, the only parameter that influences the results is the value of ε. Reference “Change-like” points a. Figure 7: Change like effect associated with phantom points. When transforming the analyzed scan into the reference frame, outliers nearby edges in the analyzed scan will be transformed as well. And thereby will be compared to inliers in the reference. To differentiate between actual changes and those outliers, compensation for the edge effect is applied. In order to compensate for such edge effect, a minimum range difference is searched in the point’s neighborhood during the range subtraction. This way, it is compared to other points belonging to that object in the reference scan and not to other objects falling way behind. The proposed solution for reduction this kind of edge effect, involves pre detection of edges in the analyzed scan using Laplacian of a Gaussian (LoG) filter. b. Figure 9: a) results of applying the change detection with ε=5cm for range difference (window 1 in figure 8), b) results with Δh=5cm for normal distance. Figure 9a shows that applying a threshold value of 5cm for range difference yields a large amount of ground returns that are categorized as changes in those regions due to relatively big incidence angles there in the reference scan. Therefore, a change detection scheme that is based on a mere range subtraction for such cluttered scenarios without filtering the data exhibits sensitivity to ranging uncertainty as a function of incidence angle (see Section 2.3). To reduce the false changes resulting from the naive range-difference based comparison, analysis of changes along the normal direction is applied as proposed in Section 2.3. The threshold value Δh is set to 5cm. This mode of comparison is applied to all range differences smaller than 50 cm and whose incidence angle is large. The results of this modification are shown in Figure 9b. The improvement in terms of amount of false alarm detections is substantial. Other than only demonstrating the effect of the proposed modification, it tells about laser ranging process. We note that in reference to the results in Zeibak and Filin (2007), the use of a dilation-like operator in the form of locally dilated close objects and eroding the background enabled eliminating such errors. However, this process was too global when applied to the whole scan. 4. RESULTS AND DISSCUSION The application of the change detection model is demonstrated in Figure on a complete scene (the analyzed scan is compared here with the reference). Changes in this scene between the two epochs are mainly passersby and parking vehicles. They indicate the level of detail that can be noticed at various ranges. Considering the very different views from which the two scenes were acquired (about 11 meters distance between scan positions), the ability to detect walking persons shows the great potential of the proposed approach to detect changes of various size and within a cluttered natural environment while managing occlusion and laser scanning related artifacts effects between the scans. Since the proposed model involves different phases, beginning with the overall visibility query concept and then adapts itself to the ranging related features and artifacts, we evaluate the contribution that each of these processes has on the comparison. To illustrate the different phases, we focus on three different regions in the scan that best demonstrate the contribution of each phase (see Figure 8). Figure 8: Changes detected in the analyzed scan when compared to the reference one. 505 The International Archives of the Photogrammetry, Remote Sensing and Spatial Information Sciences. Vol. XXXVII. Part B5. Beijing 2008 Next, figure 10a and 10b show the results using the range subtraction and normal distance test (Δh =5cm) in a region featuring a significant amount of discontinuities. One can notice the very many false alarms appearing on static objects, close to their edges, e.g., windows boundaries, poles, signs, etc. This edge effect increases further in regions with poor registration accuracy. Detailed study of the error sources and their effect on the detection of changes shows that unless considered, a large amount of false alarms may result. However, when accounted for, a relatively small detection threshold (like the 5 cm value set here) can be applied. REFERENCES a. Girardeau-Montaut, D., Roux, M., Marc, R., Thibault, G., 2005. Change detection on points cloud data acquired with a ground laser scanner. International Archives of Photogrammetry, Remote Sensing. 36(3/W19):30-35 b. Gosliga van R., Lindenbergh, R., Pfeifer, N., 2006. Deformation Analysis of a Bored Tunnel by Means of Terrestrial Laserscanning. Image Engineering and Vision Metrology, ISPRS Symposium, Dresden. c. d. Hsiao, K. H., Yu, J., Tseng, Y. H., 2004. Change Detection of Landslide Terrains Using Ground-Based Lidar Data. International Archives of Photogrammetry and Remote Sensing, 35(B5) Lindenbergh, R., Pfeifer, N., 2005. A Statistical Deformation Analysis of Two Epochs of Terrestrial Laser Data of a Lock. 7th Conference on Optical 3-D measurement techniques, Vienna. Figure 10: a, b) Results of applying the change detection with ε=50cm, ε=5cm (windows 2,3 in Figure ). c, d) applying the change detection with the elimination of the edge effects. Schäfer, T., T. W., Peter Kyrinovič, Miriam Zámečniková, 2004. Deformation Measurement Using Terrestrial Laser Scanning at the Hydropower Station of Gabčíkovo. INGEO 2004 and FIG Regional Central and Eastern European Conference on Engineering Surveying. Bratislava, Slovakia Following the application of the edge effect correction, spurious detected changes relating to edge effect are eliminated. In Figure 10c and 10d the results of eliminating edge related artifacts can be seen. Notable false alarms that have been removed can be seen with many of the poles and particularly on edges. As with the modification to the range subtraction, the ability to model the effect of along-edge points is exhibited by their elimination. Zeibak, R., Filin, S., 2007. Change detection via terrestrial laser scanning. International Archives of Photogrammetry and Remote Sensing. 36(3/W52): 430-435. Lichti, D.D., Gordon, S.J., Tipdecho, T., 2005. Error Models and Propagation in Directly Georeferenced Terrestrial Laser Scanner Networks. Journal of Surveying Engineering, Vol. 131, No. 4, November 1, 2005. 5. CONCLUSIONS Sotoodeh, S., 2006. Outlier detection in laser scanner point clouds. International Society of Photogrammetry and Remote Sensing. This work has demonstrated the feasibility of change detection with no imposition of external constraints. The results emphasize the capability of the proposed model to detect changes in general and cluttered scenes via terrestrial laser scanning irrespective of the scanning positions, showing its great potential. It has also shown that multi-scale objects appearing in different depths are successfully detected. Also dynamic objects that pass through the scene during a single scan could be definitely alarmed as changes. Barnea, S., Filin, S., 2008. Registration of Terrestrial Laser Scans via Image Based Features. ISPRS Workshop on Laser Scanning 2007 and SilviLaser 2007, Espoo, September 12-14, 2007, Finland. 506

