IMPROVEMENT OF CLASSIFICATION ACCURACY Ryosuke Shibasaki
advertisement
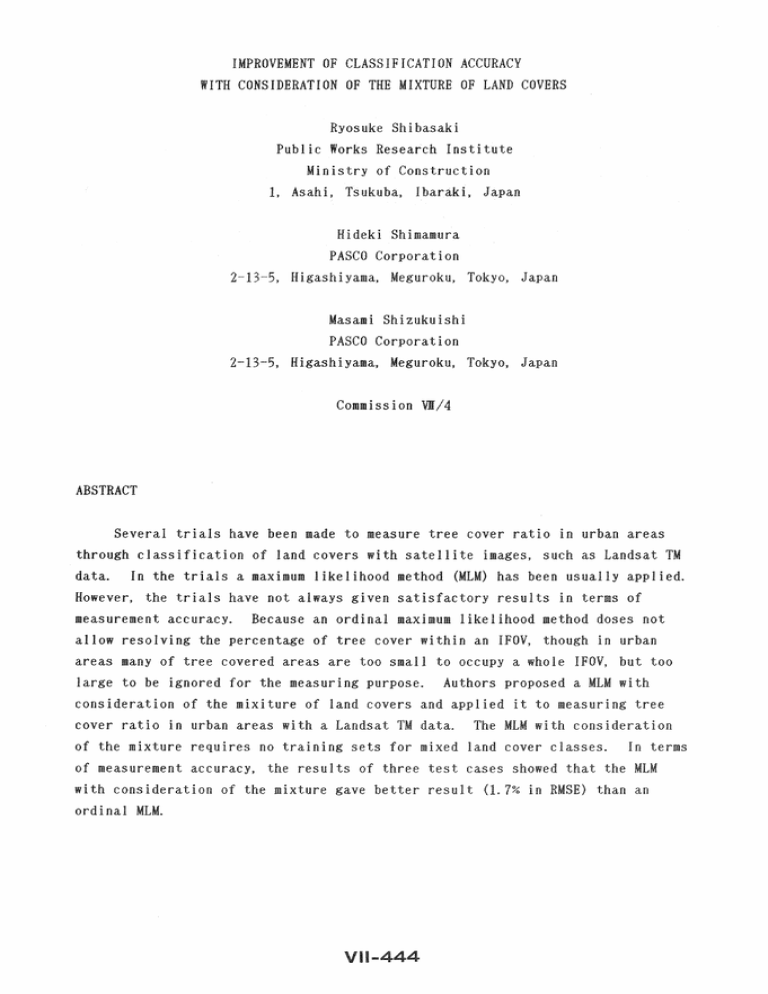
IMPROVEMENT OF CLASSIFICATION ACCURACY WITH CONSIDERATION OF THE MIXTURE OF LAND COVERS Ryosuke Shibasaki Public Works Research Institute Ministry of Construction 1. Asahi, Tsukuba, Ibaraki, 3-5, H Hi Shimamura PASCO Corporation iyama. i Shi ishi Corporation yama, Commission VJI/4 ABSTRACT Several tri s have been made to measure tree cover ratio in areas through classification land covers satellite s 1y app 1i ed. data. In the trials a maximum likelihood method (MLM) However, the trials have not always ven satis tory results in terms measurement accuracy. Because an ordi Ii Iihood not allow resolving percentage of tree cover n an IFOV, to occupy a areas many of tree covered areas are too too large to be ignored measuring purpose. Authors a consideration of the mixiture of 1 covers and appl i it to measuring tree cover ratio in th consi areas a data. The ion of the mixture requires no ning cover classes. In terms of measurement accuracy, test cases gave with consideration of the an result 7% in RMSE) ordinal MLM. INTRODUCTION Vegetation cover ratio or tree cover ratio is often used as one of the most cator environments. Tree cover ratio has been usually measured manually color aeri However, manual photo- ion and measurement of tree area require much labor and time, and has prevented from measuring tree cover ratio in many urban areas. 11 i te image data, such as Landsat resolutions are data, though their ground inferior to aerial ion of land covers in larger areas. measure tree cover ratio through classification image data, in includes multispectral Some trials have been made to land covers with satellite ch a maximum likelihood method (MLM) has been usually employed. those tri s not given satisfactory results in terms of mea surement accuracy. In urban area, especially in Japan, lands are densely utilized and many 1 tree covered areas are scatteread in 'non-tree' area. Each tree covered area is too small to occupy a whole IFOV of satellite image and to be classified as 'tree', too arge to in measuring tree cover ratio for assessing ronment. not allow reso ng the tree cover wi thin IFOV of sate 11 i te images, and fails to pick up Is in the tree cover is relat ly low. This constraint would be thought to cause serious errors in measuring tree cover ratio in urban areas. p an wi consi ion xture of land covers and applied it to measuring tree cover ratio in urban areas. Three test cases were consi assessing the performance of the MLM with the ion of the mixture in comparison an ordinal MLM. PREVIOUS STUD There exist two main groups concerning methods of resolving the mixture of covers. One group consists of the methods based on linear regression Is which relate the percentage of a object-land cover to the combination of reflectance values in tation I bands and/or some kinds of indices, such as ned from reflectance ues. However, ilding linear regression models requires pixels in which the proportion of an object-land cover is exactly determined. Acquisition of the proportion data in each pixel is encumbered in practical applications because it is not easy to determine accurately the exact locations of the mixed pixels. The other group is based on a general weighted average equation. Under the assumption that mean reflectance vector of a mixed pixel nearly equals the weighted average of component class mean vectors, the proportion of each component is given as a solution of a weighted average equation. However, it is necessary that two important constraints should be observed [3J : (1) no (pure) component class mean vector in a mixture must be similar to a weighted average of the other component class mean vectors. (2) in case the number of spectral bands available is less than the number of components, estimation accuracy of the proportion is poor. An approximate MLM [1J would be thought of an extension of an ordinal MLM. The method yields the proportion of a component through calculating the differences of Mahalanobis distances between a mixed pixel and each component class of the mixture. The method proved promising in five test cases for geological applications. A CLASSIFICATION METHOD WITH CONSIDERATION OF THE MIXTURE Figure 1 shows a classification procedure with consideration of the mixture of land covers. The procedure is based on MLM. MLM is widely used in image classification and many image processing systems provide programs of MLM. At the first stage of the procedure, some of pixels of pure components are extracted for training sets. At the same time, mean vecters and covariance matrices of mixed classes are estimated through weighted average of mean vectors and covariance matrices of pure component classes. The weight values are proportional to the percentages of pure components. The stepwise proportion of mixture are given for mi classes. Step width is determined with the consideration of degree of spectral separation between pure classes. Both extraction of only pure pixels and estimation of mean vectors and covariance matrices of mixed classes are not unencumbered because the exact locations of only pure component pixels must be determined and the standard of pixel extraction for pure pixels is clear. The first classification th MLM is Training Set Acquisition Training Sets of Pure Component Classes (Tree, Flat House etc) 1st Classification with M L M for Pure Classes I Estimation of Mean Vectors and Covariance Matrices of Mixed Classes through Weighted Average of Unclassified Pixels Classified Pure Component Class Mean Pixels into Pure Class Vectors and Covariance Matrices eg.) Tree + House 80~~ 20% 2nd ClassIfication H-' wi th M L M for Mixed Classes 11, Pixels Classified in Mixed Class F Ca.lculation of Tree Cover Area (Tree Cover Ratio) 1 MLM Based Classification Procedure th Consideration of the Mixture of Land Covers (MLM: Maximum Likelihood Method) first classification sts a only pure classes. In out carri lectance vector of an objec is distance 1 threshold Mahal nearest pure component class mean vector. A pixel whose minimum In test the threshold remains unclassifi anobis distance is larger cases, ass ld to be 2a. the p At unclassifi Is into mi classes. tree cover area. pixel yiel at first stage are tree cover amount classifi class mean vectors we ass ion average pure component class mean exists serious class happen to icult in case mean vector discrimination is a come close to mean vector of any other class. much more pixels priori algori assume that there pure classes than pixels of classes, and to pure classes in classification. lects st classification s assumption in a simplified COMPARISON ON ACCURACY For the comparison of classification accuracy, three test cases were Two test areas, Honmoku (1) Yokohama Port, about 30km stant from and (2) include large residenti The other test area, Kohoku , are near center of area tree covered areas Town (NT) is located about 20km area consists tree areas, res i test areas is x is 30mX in size. areas in size, is di Actual tree cover ratio interpretation 3 stant color aeri actual tree cover ratio cells in tree cover ratio obtai 1y, c 4, 6. in Ie L are to classification of a consi ion mixture are into pure 625 cells were classifi compar i son, tree cover ratios 9, A classification wi in Photo 7, 8 first s classification in F 1 3a in classes an Id Actual Tree Cover MLM with Consideration of Mixture Ordinal MLM (threshold ;30') H o n III o k u 1 Photo 1 Photo 4 Photo 2 Photo 5 Photo Photo 6 Photo 9 Photo 7 H o n m o k u 2 (3 K o h o k u N T Photo 3 100~~ Photo 1~9 Comparison of Measurement Accuracy of Tree Cover Ratio 6 99~,,; 0% Table. 1 Pure and Mixed Land Cover Classes for Test Cases Pure Classes Tree 1 Tree 2 Flat House Mixed Classes Flat House 20% 80% 60% 40% 60% 40% 20% - High Rise Apartment Tree 80% (HRA) 60~'6 -40% 20% Grass 1 Bare Land 1 2 Grass 80% 60% 40% 20% 3 HRA 20~~ - 40% 60% 80% - Bare Land 20% 40% 60% 80% Table. 2 Comparison of Measurement Accuracy of Tree Cover Ratio Case Tree Cover ratio of Test area (%) Honmoku 1 Honmoku 2 J Kohoku Nt RMSE (~~) 15. 6 15.5 7.6 I Actual (- ) Ordinal MLM MLM with Consideration of the Mixture ( ) (- ) - 10. 1 (.,-5. 5) 11. 8 (-3.7) 5.3 (-2.3) 4. 1 13.5 (-2.1) 16.2 (0.7) 9. 5 (1.9) 1.7 Data Aerial Photos (Aug. 1984) Landsat TM (July. 1987) (Discrepancies (MLMs - Actual) are within parentheses) VII ... 450 minimum Mahalanobis distance. The results with an ordinal MLM ( Photo 7"--9 ) show that many of pixels in which tree cover ratios are relatively low are classified into non-tree classes. Table 2 shows tree cover ratio of each test area. In every case, tree cover ratio obtained with the MLM with consideration of the mixture comes closer to actual, ratio than that with an ordinal MLM. Measurement accuracy with the MLM with consideration of the mixture is 1.7% in RMSE, while accuracy with an ordinal MLM is 4.1% in RMSE. In these test cases, an ordinal MLM has tendency of underestimation because a MLM failed to pick up pixels in which tree cover ratio is relatively low. CONCLUSIONS (1) A classification method with consideration of the mixture of land covers was developed. The results of three test cases showed the measurement accuracy of tree cover ratio with the classification method with consideration of the mixture is 1.7% in RMSE, which is better than that with an ordinal MLM in every case. (2) The classification method with consideration of the mixture is based on MLM. and requires no training sets for mixed land cover classes. These mean that the classification method with consideration of the mixture does not require much more time and labor than an ordinal MLM does in practical appl ications. REFERENCES [lJ March, S.E., Switzer, P., Kowalik, R. J.P.; Resolving the Percentage of Component Terrains within Single Resolution Elements, Photogrammetric Engineering and Remote Sensing, Vol.46, No.8, 1980, pp.l079-1086. [2J Work, E.A .. Arbor, A., Gilmer. D. S.: Utilization of Satellite Data for Inventorying Prairie Ponds and Lakes, Photogrammetric Engineering and Remote Sens ing, vol. 42. No.5, 1976, pp.685-694. [3J Matsuo, Y.; Theoretical Considerations on the Estimation Method of Land Cover Mixing Ratio Us ing MSS Data. Trans. J. S. 1. D. R. E. Vol. 116, Apr. 1985, pp.19-24. (in Japanese). VII-451

