Instability Limits to “Fast” Light Pulse Propagation Michael D. Stenner and
advertisement
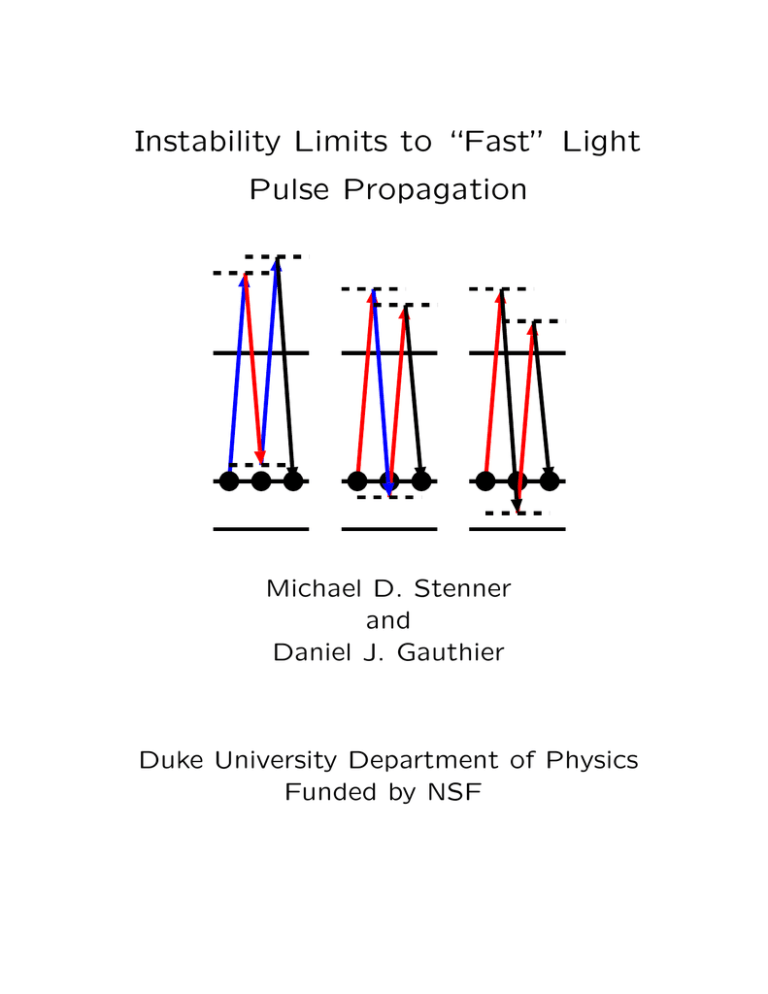
Instability Limits to “Fast” Light Pulse Propagation Michael D. Stenner and Daniel J. Gauthier Duke University Department of Physics Funded by NSF New Anomalous Dispersion Technique anomalous dispersion absorption coefficient (α) refractive index (n-1) A new method for creating anomalous dispersion was recently proposed and implemented. 0 -4 -2 0 frequency 2 4 We are interested in studying this system in the high gain limit. Steinberg and Chiao (1994), Wang (2000) Creation of Bichromatic Raman Gain ω+ ω- 39 K vapor cell ∆ω ω- ω+ ω- ω+ ∆g Large ground state coherence results in extremely large optical amplification! Wang et al. used red-detuned Raman pumps in cesium. Wang (2000), Harris (1997) Nonlinear Optical Processes in the Driven Vapor: Raman Stokes/anti-Stokes Raman anti-Stokes ∆ω ω− ω+ ∆g generates: ( ω+ + ∆ g ) − Raman Stokes/anti-Stokes coupling generates: ( ω+ +- ∆ g ) − Bloembergen (1967) Nonlinear Optical Processes in the Driven Vapor: Induced Modulation Instability Induced Modulation Instability generates: ( ω+ -+ n ∆ ω) - with the Raman processes: (ω + + - ∆ g -+ n ∆ ω) Harris PRA (2002) and references therein, Hasegawa (1980), Millot (2001) Experimental Setup ω+ 39 Output power (mW) ω− 5 4 3 2 1 0 0 Bichromatic K Monochromatic 10 20 30 40 50 Single-beam input power (mW) 60 • Threshold (0.1% conversion) occurs at αL ≈ −10 • We easily see 10% conversion! • Using bichromatic light dramatically reduces the threshold! Optical Spectrum of the Generated Light Power (arb units) fine peaks at ∆ω ∆g pump frequency -1 0 1 Frequency (GHz) 2 Stokes/anti-Stokes coupling ( ω+ +- ∆ g ) − Induced Modulation Instability ( ω+ +- ∆ g +- n ∆ ω ) − Raman anti-Stokes ( ω+ + ∆ g ) − Electronic Power Spectrum Detector power (dBm) • Look at electronic spectrum of detector output • Finer resolution in frequency and power 0 -20 -40 -60 -80 0 ∆g 2∆g 500 1000 3∆g 4∆g 1500 2000 2500 -40 -60 -80 400 ∆ω 420 RBW = 1 MHz 440 460 480 Frequency (MHz) 500 • Spectrum extends over several GHz • Harris and Sokolov predict comb of δ functions • 20 dB above noise for > 1 GHz, not discrete peaks Harris and Sokolov (1998) Temporal Evolution of the Intensity (arb units) Generated Light 0 20 40 60 80 100 500 ps 10 15 20 Time (ns) 25 30 • Large structure at 40 ns → 25 MHz = ∆ω • Small structure at 1 ns → 1 GHz ≈ 2∆g • At the limit of the analog bandwidth of the oscilloscope! • May be chaotic – not enough vertical resolution to analyze! Conclusions • The induced modulation instablility severely restricts this “fast” light approach • Generates broad (> 3 GHz) continuous spectrum from pure bichromatic (25 MHz) light • Potentially chaotic behavior • Slower analog to ultrafast pulse generation techniques of Harris • Same processes (Raman amplification and Induced Modulation Instability) used in modern fiber telecommunications research
