Why Does Small Business Matter?
advertisement
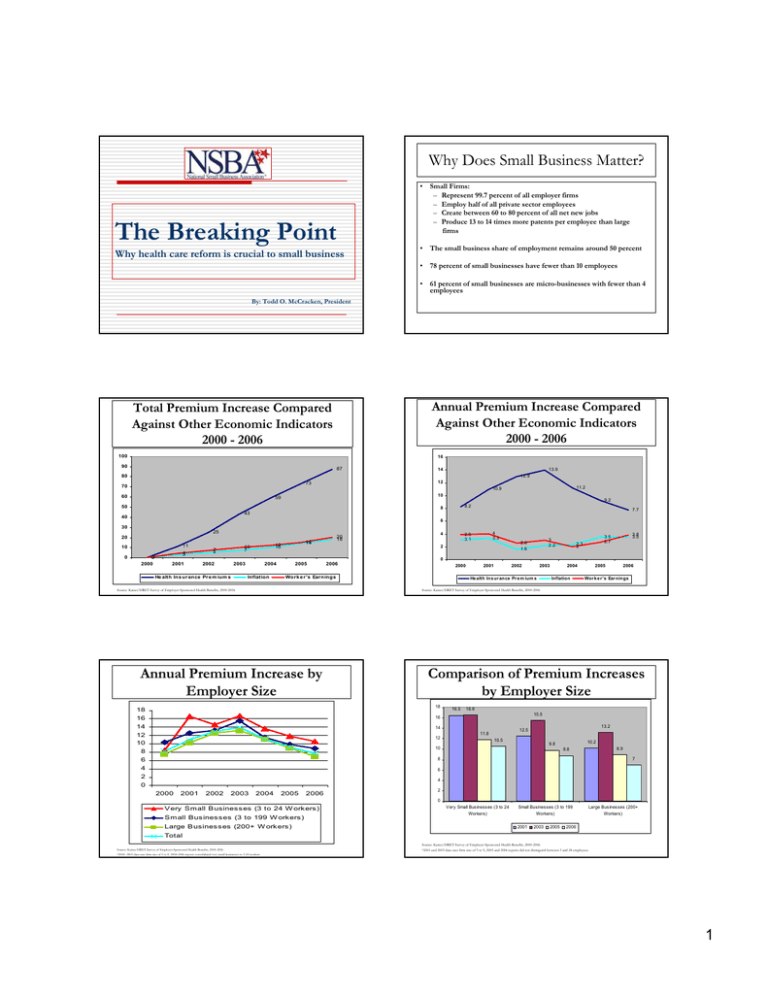
Why Does Small Business Matter? The Breaking Point Why health care reform is crucial to small business • Small Firms: – Represent 99.7 percent of all employer firms – Employ half of all private sector employees – Create between 60 to 80 percent of all net new jobs – Produce 13 to 14 times more patents per employee than large firms • The small business share of employment remains around 50 percent • 78 percent of small businesses have fewer than 10 employees • 61 percent of small businesses are micro-businesses with fewer than 4 employees By: Todd O. McCracken, President Annual Premium Increase Compared Against Other Economic Indicators 2000 - 2006 Total Premium Increase Compared Against Other Economic Indicators 2000 - 2006 100 16 90 87 14 13.9 80 12.9 12 73 70 11.2 10.9 60 10 59 9.2 50 8.2 8 7.7 43 40 6 30 25 11 10 0 0 2000 4 3 15 14 12 10 10 7 7 5 4 20 18 20 4 3.3 3.9 3.1 3 2.2 2.6 1.6 2 3.8 3.5 3.5 2.7 2.3 2 0 2001 2002 2003 He alth Ins ur ance Pr e m ium s 2004 Inflation 2005 2006 2000 Wor k e r 's Ear nings Source: Kaiser/HRET Survey of Employer-Sponsored Health Benefits, 2000-2006 2001 2002 2003 He alth Ins urance Pr e m ium s 2004 Inflation 2005 2006 Work e r's Earnings Source: Kaiser/HRET Survey of Employer-Sponsored Health Benefits, 2000-2006 Annual Premium Increase by Employer Size Comparison of Premium Increases by Employer Size 18 18 16 14 12 10 8 6 4 2 0 16.5 16.6 15.5 16 14 12 13.2 12.5 11.8 10.5 10.2 9.8 10 8.9 8.8 7 8 6 4 2000 2001 2002 2003 2004 2005 2006 2 0 V ery Small B usines s es (3 to 24 W ork ers ) S mall Bus ines ses (3 to 199 W ork ers ) Large B usines s es (200+ W ork ers ) Very Small Businesses (3 to 24 Workers) Small Businesses (3 to 199 Workers) 2001 2003 2005 Large Businesses (200+ Workers) 2006 Total Source: Kaiser/HRET Survey of Employer-Sponsored Health Benefits, 2000-2006 *2000- 2003 data uses firm size of 3 to 9, 2004-2006 reports consolidated very small businesses to 3-24 workers Source: Kaiser/HRET Survey of Employer-Sponsored Health Benefits, 2000-2006 *2001 and 2003 data uses firm size of 3 to 9, 2005 and 2006 reports did not distinguish between 3 and 24 employees. 1 Overall Percentage of Firms Offering Health Benefits, 2000 - 2006 Percentage of Businesses Offering Health Benefits by Firm Size 66 120% 65 99 % 99% 9 8% 98% 9 9% 98% 98% 100% 65 64 80% 63 63 63 57% 58 % 58% 55 % 60% 62 52% 62 4 7% 48% 61 61 40% 60 60 20% 59 59 0% V ery S m all B us ines s es (3 - 9 E m ploy ees ) 2000 2001 2002 Large B us ines s (200+ E m ploy ees ) 58 57 56 2003 2004 2005 2000 2006 2001 2002 2003 2004 2005 2006 Source: Kaiser/HRET Survey of Employer-Sponsored Health Benefits, 1999-2006; KPMG Survey of Employer-Sponsored Health Benefits, 1996. Source: Kaiser/HRET Survey of Employer-Sponsored Health Benefits, 2006 Percentage of Firms Offering Health Benefits, by Firm Size in 2006 120% Percentage of Businesses Offering More than One Health Plan Option by Firm Size 90 100% 87% 92% 98% 79 80 70 73% 80% 57 60 60% 50 48% 39 40 40% 30 20 20% 20 10 0% 3 to 9 10 to 24 25 to 49 50 to 199 200+ Firm Size by Num ber of Em ployees 0 Sm all Firm s (3 to 199 Wor k e r s ) 200 - 999 Work e rs 1,000 to 4,999 Wor k e r s 5,000+ Work e rs Source: Kaiser/HRET Survey of Employer-Sponsored Health Benefits, 2005 Percentage of Small Employers Considering Changes to Employee Health Plans Not considering any changes in the next year 49% Source: NSBA Member Survey, October 2005 Considering change in the next year 51% Source: Kaiser/HRET Survey of Employer-Sponsored Health Benefits, 2005 2 Expected Changes to Employee Insurance Plans 50% 45% Percentage of Employee Premium Paid for by Employer 44% 41% 49% or less of Premium 30% 40% 35% 30% 22% 25% 100% of Premium 30% 24% 20% 15% 15% 10% 3% 5% Increasing Employee Share Reducing Benefits Switching to Reducing High Deductible Contributions to Plan HSA/FSA Dropping Coverage O ther O ptions 100% of Premium Source: NSBA Member Survey, October 2005 80% to 99% of Premium 50% to 80% of Premium 49% or less of Premium Source: NSBA Member Survey, October 2005 Allowable State Variations Within a Particular Plan Employee Premium Cost-Sharing Trend Small vs Large Business 30 $7,000 25 $6,000 Employee Share 80% to 99% of Premium 19% 50% to 80% of Premium 21% 0% $5,000 20 $4,000 15 $3,000 10 $2,000 5 $1,000 0 AK AL AR AZ CA CO DE FL ID IL KS MA MD ME MI MN NC ND NH NJ NY OK SC SD TX VT WA WI WY $0 2003 2004 2005 2006 2007 Large Employers 2008 2009 2010 Ratios 2.5 10.8 3.3 Source:Hewitt Associates, US Bureau of Labor Statistics 9.3 20.3 23.6 1.7 3 • Individual Responsibility • Broad Reform of the Insurance Market – Association Health Plans (AHPs) – Attempt to provide cost-cutting by allowing trade-associations to create a national pool for their members under a new set of federal rules – – • Would create adverse selection and segment the market due to AHP’s ability to skim off the healthiest individuals. – – Small Employer Health Benefit Plans (SEHPB) – Patterned after federal employees’ health plan, SEHPBs would establish a federally-run insurance pool for small businesses • Would create adverse selection on part of the SEHPB due to a rich benefit package, guarantee issue and government subsidies on the plan • 7 2.3 4.2 2.5 8.2 8.1 2 3.5 2 1 14 2.5 21.3 27.4 1 4.9 20.5 27.3 NSBA Health Care Proposal Why They Won’t Work • 1.2 7.9 Source: National Association of Insurance Commissioners Piecemeal Solutions: • 4 1-99 Employees Enzi Health Care Proposal – Would allow for limited AHPs with state oversight and preempt certain states’ rating rules • Best of all three initiatives, but doesn’t go far enough in creating broad reform and enhancing consumer involvement All individuals would be required to obtain coverage providing for the spreading of risk with all individuals in the insurance pool. Establishment of a federally-defined basic minimum package that is truly basic in nature Actuairily-determined rate bands established within which insurance companies could price their products Insurance companies would operate under a guarantee issue system States would retain oversight and authority over all plans under the federal framework • Provide Subsidies for Low- Income • Reshape Health Insurance Tax Incentives • Reduce Costs and Improve Quality – – – – – – Individuals and families would receive federal financial assistance for health premiums, based upon income Tax parity for all purchase of health insurance, whether purchased through an employer or individually Cap tax-preference on health expenditures at the premium level for the required package Instituting increased consumerism requires ample information be available to consumers Increased IT in health care through electronic medical records and procedures to both reduce errors and increase efficiency Pay-for-Performance based on actual health outcomes and standards established through evidence-based indicators and protocols 3
